PDF Publication Title:
Text from PDF Page: 013
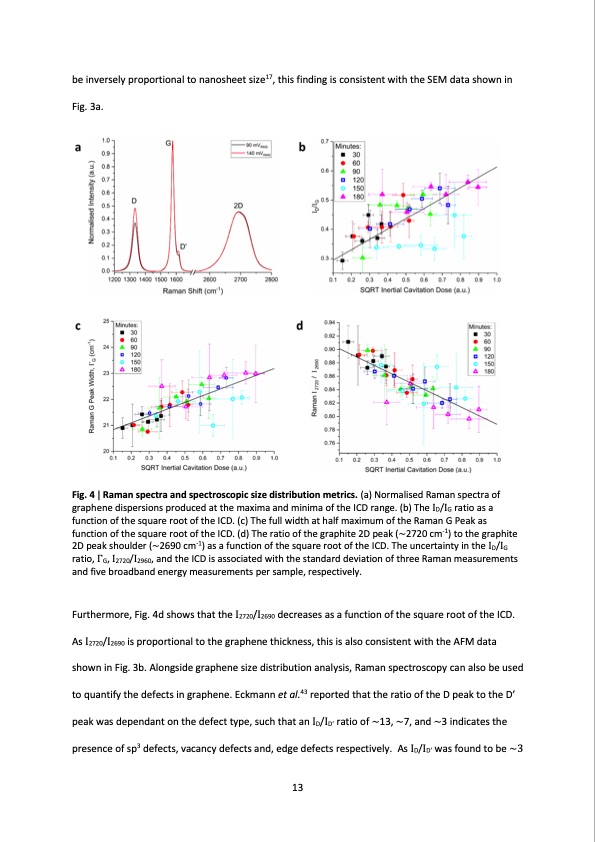
be inversely proportional to nanosheet size17, this finding is consistent with the SEM data shown in Fig. 3a. Fig. 4 | Raman spectra and spectroscopic size distribution metrics. (a) Normalised Raman spectra of graphene dispersions produced at the maxima and minima of the ICD range. (b) The ID/IG ratio as a function of the square root of the ICD. (c) The full width at half maximum of the Raman G Peak as function of the square root of the ICD. (d) The ratio of the graphite 2D peak (~2720 cm-1) to the graphite 2D peak shoulder (~2690 cm-1) as a function of the square root of the ICD. The uncertainty in the ID/IG ratio, ΓG, I2720/I2960, and the ICD is associated with the standard deviation of three Raman measurements and five broadband energy measurements per sample, respectively. Furthermore, Fig. 4d shows that the I2720/I2690 decreases as a function of the square root of the ICD. As I2720/I2690 is proportional to the graphene thickness, this is also consistent with the AFM data shown in Fig. 3b. Alongside graphene size distribution analysis, Raman spectroscopy can also be used to quantify the defects in graphene. Eckmann et al.43 reported that the ratio of the D peak to the D’ peak was dependant on the defect type, such that an ID/ID’ ratio of ~13, ~7, and ~3 indicates the presence of sp3 defects, vacancy defects and, edge defects respectively. As ID/ID’ was found to be ~3 13PDF Image | Cavitation Liquid Phase Exfoliation of Graphene
PDF Search Title:
Cavitation Liquid Phase Exfoliation of GrapheneOriginal File Name Searched:
1809-07630.pdfDIY PDF Search: Google It | Yahoo | Bing
Salgenx Redox Flow Battery Technology: Power up your energy storage game with Salgenx Salt Water Battery. With its advanced technology, the flow battery provides reliable, scalable, and sustainable energy storage for utility-scale projects. Upgrade to a Salgenx flow battery today and take control of your energy future.
| CONTACT TEL: 608-238-6001 Email: greg@infinityturbine.com | RSS | AMP |