PDF Publication Title:
Text from PDF Page: 006
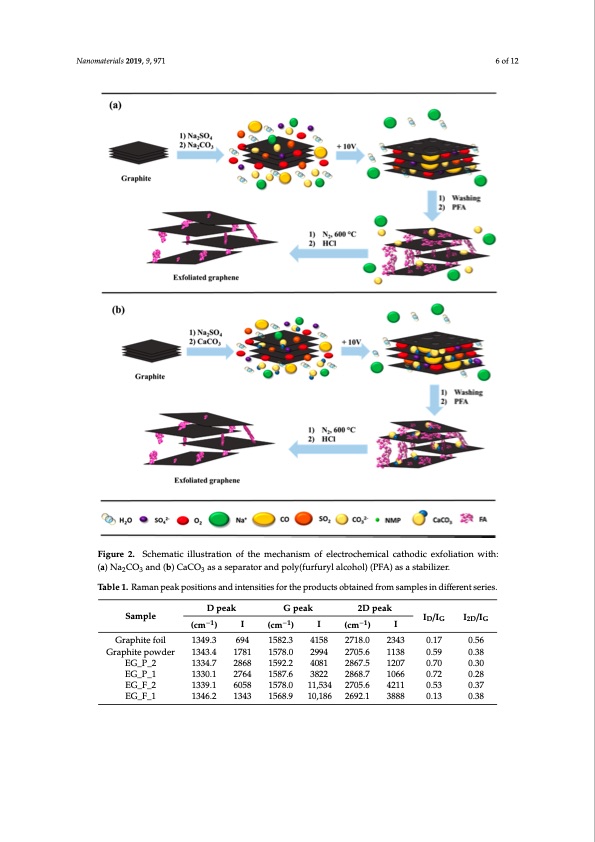
Nanomaterials 2019, 9, 971 6 of 12 Nanomaterials 2019, 9, x FOR PEER REVIEW 6 of 12 Figure 2. Schematic illustration of the mechanism of electrochemical cathodic exfoliation with: (a) Figure 2. Schematic illustration of the mechanism of electrochemical cathodic exfoliation with: Na2CO3 and (b) CaCO3 as a separator and poly(furfuryl alcohol) (PFA) as a stabilizer. (a) Na2CO3 and (b) CaCO3 as a separator and poly(furfuryl alcohol) (PFA) as a stabilizer. Table 1. Raman peak positions and intensities for the products obtained from samples in different series. Raman spectroscopy is a method particularly useful for characterizing graphene/graphite type materials [29,30]. Among others, Raman spectroscopy makes it possible to distinguish graphite-based D peak G peak 2D peak materials fSraomplgeraphene-based ones, to estimate graphene layers stacked toIge/Ither (SILG/I – Single DG 2DG (cm−1) I (cm−1) I (cm−1) I Layered Graphene, FLG – Few Layered Graphene, and MLG – Multi Layered Graphene Graphite foil 1349.3 694 1582.3 4158 2718.0 2343 0.17 0.56 differentiation), and to resolve other problems. Figure 3a–d provides Raman spectra of graphene Graphite powder 1343.4 1781 1578.0 2994 2705.6 1138 0.59 0.38 obtained in the two ways with two different separators, Na2CO3 and CaCO3. Additionally, Table 1 EG_P_2 1334.7 2868 1592.2 4081 2867.5 1207 0.70 0.30 presents the position and intensity of the peaks in Figure 3. Figure 3b,d show the Raman spectra of EG_P_1 1330.1 2764 1587.6 3822 2868.7 1066 0.72 0.28 the graphene products obtained with different separators, where the increased value of ID/IG suggests EG_F_2 1339.1 6058 1578.0 11,534 2705.6 4211 0.53 0.37 the decreasEeGo_Ff _g1raphene 1a3g4g6l.2omer1a3t4e3thick15n6e8s.s9. As10s,h1o86wn 2in69T2.a1ble 13,8a88strong0.1r3elative0i.n38tensity of the 2D peak indicates fewer stacked layers, which in foil exfoliation with CaCO3 is beneficial for the formation of graphene. The presence of graphitic carbon in the EG_F_2 and EG_F_1 samples (Figure 3b) revealed the well-documented D and G bands at 1351 and 1579 cm−1, with an ID/IG ratio of 0.53 and 0.13, respectively. An analysis of the Raman spectra for pristine graphite foil (Figure 3a) and pristine graphite powder (Figure 3c) leads us to believe that the foil is closer to an ideal graphene material than the powder. This conclusion results from the ID/IG ratio, which is only 0.17 for the foilPDF Image | Electro-Exfoliation of Graphite to Graphene
PDF Search Title:
Electro-Exfoliation of Graphite to GrapheneOriginal File Name Searched:
graphene-aqueous-salt-al.pdfDIY PDF Search: Google It | Yahoo | Bing
Salgenx Redox Flow Battery Technology: Power up your energy storage game with Salgenx Salt Water Battery. With its advanced technology, the flow battery provides reliable, scalable, and sustainable energy storage for utility-scale projects. Upgrade to a Salgenx flow battery today and take control of your energy future.
| CONTACT TEL: 608-238-6001 Email: greg@infinityturbine.com | RSS | AMP |