PDF Publication Title:
Text from PDF Page: 009
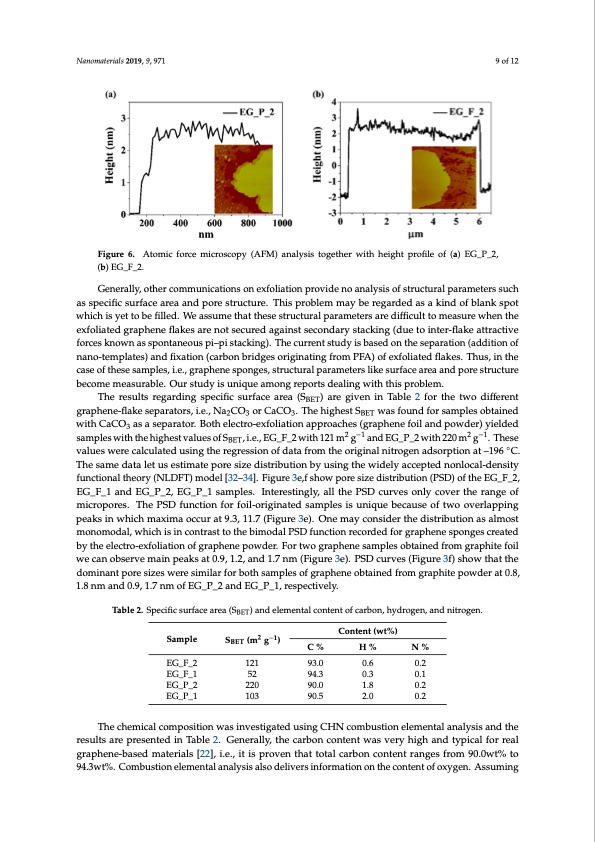
sonication in ethanol. The results are presented in Figure 6. Typical graphene sheet thickness is about 2 nm. Assuming that the thickness of single layered graphene is 0.51 nm [31] and the interlayer distance is 0.34 nm the measured value corresponds to three layered graphene: 3 × 0.51 nm + 2 × 0.34 nm = 2.17 nm. This result is consistent with Raman spectroscopy studies which also suggest the Nanomaterials 2019, 9, 971 9 of 12 performed electro-exfoliation delivers few-layered graphene mainly. FiguFriegu6.reA6.toAmtoicmfiocrfcoercmeimcriocsrcoospcoyp(yA(FAMFM) a)naanlyalsyisistotgoegtehtehrerwwitihthhheeigighhttpprroofiflieleooff((a))EG_P_2, (b) (b) EEG__FF__22. . Generally, other communications on exfoliation provide no analysis of structural parameters such Generally, other communications on exfoliation provide no analysis of structural parameters as specific surface area and pore structure. This problem may be regarded as a kind of blank spot such as specific surface area and pore structure. This problem may be regarded as a kind of blank which is yet to be filled. We assume that these structural parameters are difficult to measure when the spot which is yet to be filled. We assume that these structural parameters are difficult to measure exfoliated graphene flakes are not secured against secondary stacking (due to inter-flake attractive when the exfoliated graphene flakes are not secured against secondary stacking (due to inter-flake forces known as spontaneous pi–pi stacking). The current study is based on the separation (addition of attractive forces known as spontaneous pi–pi stacking). The current study is based on the separation nano-templates) and fixation (carbon bridges originating from PFA) of exfoliated flakes. Thus, in the (addition of nano-templates) and fixation (carbon bridges originating from PFA) of exfoliated flakes. case of these samples, i.e., graphene sponges, structural parameters like surface area and pore structure Thus, in the case of these samples, i.e., graphene sponges, structural parameters like surface area and become measurable. Our study is unique among reports dealing with this problem. pore structure become measurable. Our study is unique among reports dealing with this problem. ) are given in Table 2 for the two different The results regarding specific surface area (SBET) are given in Table 2 for the two different The results regarding specific surface area (S BET graphene-flakeseparators,i.e.,NaCO orCaCO.ThehighestS wasfoundforsamplesobtained 23 3 BET graphene-flake separators, i.e., Na2CO3 or CaCO3. The highest SBET was found for samples obtained withCaCO asaseparator.Bothelectro-exfoliationapproaches(graphenefoilandpowder)yielded 3 with CaCO3 as a separator. Both electro-exfoliation approaches (graphene foil and powder) yielded sampleswiththehighestvaluesofS ,i.e.,EG_F_2with121m2g−1and2EG−_1P_2with220m2g−1.These2 −1 BET samples with the highest values of SBET, i.e., EG_F_2 with 121 m g and EG_P_2 with 220 m g . values were calculated using the regression of data from the original nitrogen adsorption at –196 ◦C. These values were calculated using the regression of data from the original nitrogen adsorption at – The same data let us estimate pore size distribution by using the widely accepted nonlocal-density 196 °C. The same data let us estimate pore size distribution by using the widely accepted nonlocal- functional theory (NLDFT) model [32–34]. Figure 3e,f show pore size distribution (PSD) of the EG_F_2, density functional theory (NLDFT) model [32–34]. Figure 3e,f show pore size distribution (PSD) of EG_F_1 and EG_P_2, EG_P_1 samples. Interestingly, all the PSD curves only cover the range of the EG_F_2, EG_F_1 and EG_P_2, EG_P_1 samples. Interestingly, all the PSD curves only cover the micropores. The PSD function for foil-originated samples is unique because of two overlapping range of micropores. The PSD function for foil-originated samples is unique because of two peaks in which maxima occur at 9.3, 11.7 (Figure 3e). One may consider the distribution as almost overlapping peaks in which maxima occur at 9.3, 11.7 (Figure 3e). One may consider the distribution monomodal, which is in contrast to the bimodal PSD function recorded for graphene sponges created as almost monomodal, which is in contrast to the bimodal PSD function recorded for graphene by the electro-exfoliation of graphene powder. For two graphene samples obtained from graphite foil sponges created by the electro-exfoliation of graphene powder. For two graphene samples obtained we can observe main peaks at 0.9, 1.2, and 1.7 nm (Figure 3e). PSD curves (Figure 3f) show that the from graphite foil we can observe main peaks at 0.9, 1.2, and 1.7 nm (Figure 3e). PSD curves (Figure dominant pore sizes were similar for both samples of graphene obtained from graphite powder at 0.8, 3f) show that the dominant pore sizes were similar for both samples of graphene obtained from 1.8 nm and 0.9, 1.7 nm of EG_P_2 and EG_P_1, respectively. graphite powder at 0.8, 1.8 nm and 0.9, 1.7 nm of EG_P_2 and EG_P_1, respectively. The chemical composition was investigated using CHN combustion elemental analysis and the Table 2. Specific surface area (SBET) and elemental content of carbon, hydrogen, and nitrogen. results are presented in Table 2. Generally, the carbon content was very high and typical for real graphene-based materials [22], i.e., it is proven that toCtaolntceanrtb(ownt%co) ntent ranges from 90.0wt% to (m2 g−1) 94.3wt%. Combustion elemental analysis also delivers information on the content of oxygen. Sample S BET C%H%N% Assuming that the content of unidentified elements (complement to 100% for each sample) is the EG_F_2 121 93.0 0.6 0.2 content of oxygen, the carbon-to-oxygen ratio (C/O ratio) examined by elemental analysis is high EG_F_1 52 94.3 0.3 0.1 (from11.2to17.E8G)_aPn_d2typicalto2g2r0aphenenot9t0o.0graphene1o.8xide[15,202.]2.Therefore,theobtained EG_P_1 103 90.5 2.0 0.2 sponges can be considered to consist of graphene flakes. The C/O ratio is considerably higher for the foil-originated samples, which is in accordance with the Raman spectroscopy results, proving that The chemical composition was investigated using CHN combustion elemental analysis and the results are presented in Table 2. Generally, the carbon content was very high and typical for real graphene-based materials [22], i.e., it is proven that total carbon content ranges from 90.0wt% to 94.3wt%. Combustion elemental analysis also delivers information on the content of oxygen. AssumingPDF Image | Electro-Exfoliation of Graphite to Graphene
PDF Search Title:
Electro-Exfoliation of Graphite to GrapheneOriginal File Name Searched:
graphene-aqueous-salt-al.pdfDIY PDF Search: Google It | Yahoo | Bing
Salgenx Redox Flow Battery Technology: Power up your energy storage game with Salgenx Salt Water Battery. With its advanced technology, the flow battery provides reliable, scalable, and sustainable energy storage for utility-scale projects. Upgrade to a Salgenx flow battery today and take control of your energy future.
| CONTACT TEL: 608-238-6001 Email: greg@infinityturbine.com | RSS | AMP |