PDF Publication Title:
Text from PDF Page: 008
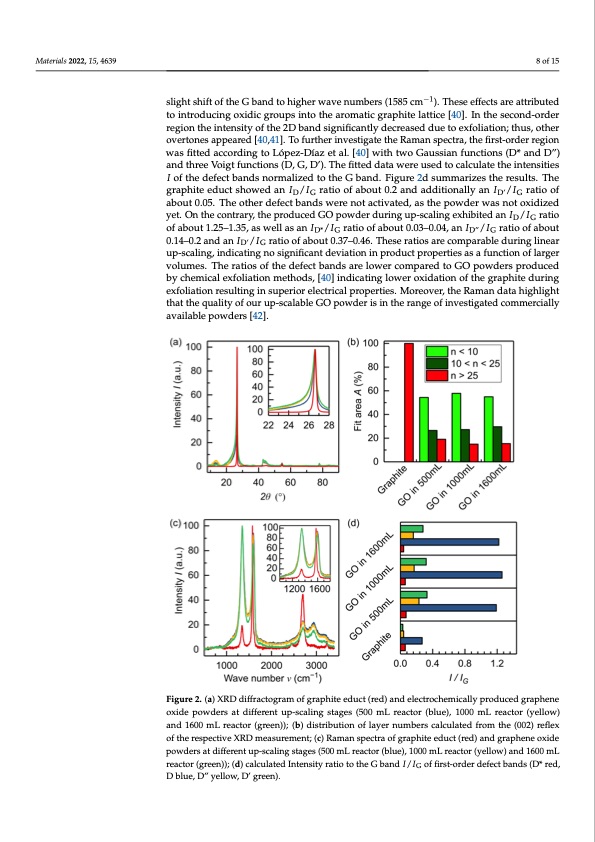
Materials 2022, 15, 4639 8 of 15 slight shift of the G band to higher wave numbers (1585 cm−1). These effects are attributed to introducing oxidic groups into the aromatic graphite lattice [40]. In the second-order region the intensity of the 2D band significantly decreased due to exfoliation; thus, other overtones appeared [40,41]. To further investigate the Raman spectra, the first-order region was fitted according to López-Díaz et al. [40] with two Gaussian functions (D* and D”) and three Voigt functions (D, G, D’). The fitted data were used to calculate the intensities I of the defect bands normalized to the G band. Figure 2d summarizes the results. The graphite educt showed an ID/IG ratio of about 0.2 and additionally an ID’/IG ratio of about 0.05. The other defect bands were not activated, as the powder was not oxidized yet. On the contrary, the produced GO powder during up-scaling exhibited an ID/IG ratio of about 1.25–1.35, as well as an ID*/IG ratio of about 0.03–0.04, an ID”/IG ratio of about 0.14–0.2 and an ID’/IG ratio of about 0.37–0.46. These ratios are comparable during linear up-scaling, indicating no significant deviation in product properties as a function of larger volumes. The ratios of the defect bands are lower compared to GO powders produced by chemical exfoliation methods, [40] indicating lower oxidation of the graphite during exfoliation resulting in superior electrical properties. Moreover, the Raman data highlight that the quality of our up-scalable GO powder is in the range of investigated commercially available powders [42]. Figure 2. (a) XRD diffractogram of graphite educt (red) and electrochemically produced graphene oxide powders at different up-scaling stages (500 mL reactor (blue), 1000 mL reactor (yellow) and 1600 mL reactor (green)); (b) distribution of layer numbers calculated from the (002) reflex of the respective XRD measurement; (c) Raman spectra of graphite educt (red) and graphene oxide powders at different up-scaling stages (500 mL reactor (blue), 1000 mL reactor (yellow) and 1600 mL reactor (green)); (d) calculated Intensity ratio to the G band I/IG of first-order defect bands (D* red, D blue, D” yellow, D’ green).PDF Image | Electrochemical Production Thermal Reduction Graphene Oxide
PDF Search Title:
Electrochemical Production Thermal Reduction Graphene OxideOriginal File Name Searched:
materials-15-04639.pdfDIY PDF Search: Google It | Yahoo | Bing
Salgenx Redox Flow Battery Technology: Power up your energy storage game with Salgenx Salt Water Battery. With its advanced technology, the flow battery provides reliable, scalable, and sustainable energy storage for utility-scale projects. Upgrade to a Salgenx flow battery today and take control of your energy future.
| CONTACT TEL: 608-238-6001 Email: greg@infinityturbine.com | RSS | AMP |