PDF Publication Title:
Text from PDF Page: 005
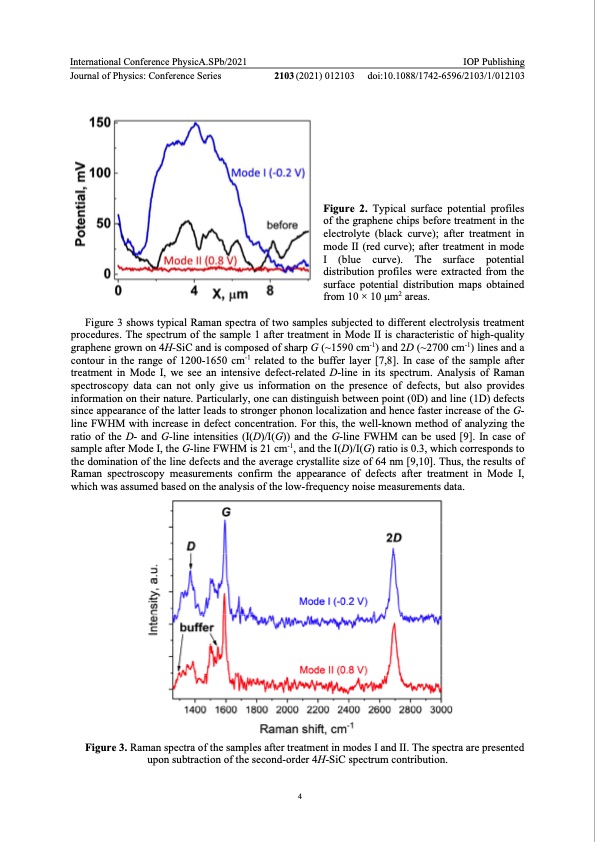
International Conference PhysicA.SPb/2021 Journal of Physics: Conference Series IOP Publishing 2103 (2021) 012103 doi:10.1088/1742-6596/2103/1/012103 Figure 2. Typical surface potential profiles of the graphene chips before treatment in the electrolyte (black curve); after treatment in mode II (red curve); after treatment in mode I (blue curve). The surface potential distribution profiles were extracted from the surface potential distribution maps obtained from 10 × 10 μm2 areas. Figure 3 shows typical Raman spectra of two samples subjected to different electrolysis treatment procedures. The spectrum of the sample 1 after treatment in Mode II is characteristic of high-quality graphene grown on 4H-SiC and is composed of sharp G (~1590 cm-1) and 2D (~2700 cm-1) lines and a contour in the range of 1200-1650 cm-1 related to the buffer layer [7,8]. In case of the sample after treatment in Mode I, we see an intensive defect-related D-line in its spectrum. Analysis of Raman spectroscopy data can not only give us information on the presence of defects, but also provides information on their nature. Particularly, one can distinguish between point (0D) and line (1D) defects since appearance of the latter leads to stronger phonon localization and hence faster increase of the G- line FWHM with increase in defect concentration. For this, the well-known method of analyzing the ratio of the D- and G-line intensities (I(D)/I(G)) and the G-line FWHM can be used [9]. In case of sample after Mode I, the G-line FWHM is 21 cm-1, and the I(D)/I(G) ratio is 0.3, which corresponds to the domination of the line defects and the average crystallite size of 64 nm [9,10]. Thus, the results of Raman spectroscopy measurements confirm the appearance of defects after treatment in Mode I, which was assumed based on the analysis of the low-frequency noise measurements data. Figure 3. Raman spectra of the samples after treatment in modes I and II. The spectra are presented upon subtraction of the second-order 4H-SiC spectrum contribution. 4PDF Image | electrolysis-related modification of graphene films
PDF Search Title:
electrolysis-related modification of graphene filmsOriginal File Name Searched:
Eliseyev-2021-Phys-3A-2103-012103.pdfDIY PDF Search: Google It | Yahoo | Bing
Salgenx Redox Flow Battery Technology: Power up your energy storage game with Salgenx Salt Water Battery. With its advanced technology, the flow battery provides reliable, scalable, and sustainable energy storage for utility-scale projects. Upgrade to a Salgenx flow battery today and take control of your energy future.
| CONTACT TEL: 608-238-6001 Email: greg@infinityturbine.com | RSS | AMP |