PDF Publication Title:
Text from PDF Page: 004
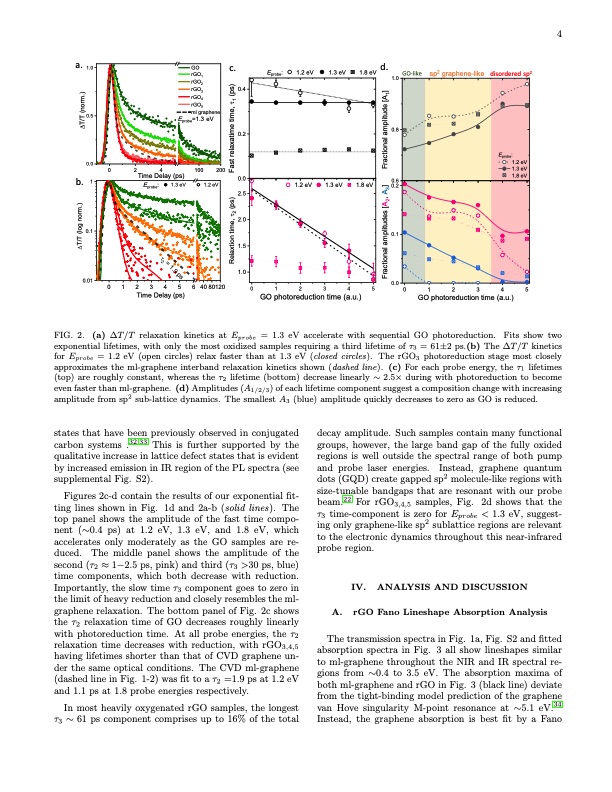
a. 1.0 GO c. rGO1 E probe : 1.2eV 1.3eV 1.8eV d. GO-like sp graphene-like disordered sp 2 2 rGO 1.0 2 ) )p1 rGO 0.4 .(A 3 s] m1 [ rGO 4 ro,te rGO5 n(ed Tmiuti / tl 0.5 ml graphene E Tp probe =1.3 eV Dem 0.8 mi a 0.2 taxlan aleroit tc E: probe 0.0 sar 1.2 eV 0 2 4 100 200 aF F 1.3 eV Time Delay (ps) 0.0 1.8 eV b. 1 0.6 Eprobe: 1.3 eV 1.2 eV 1.2 eV 1.3 eV 1.8 eV ] 0.2 ml graphene 2.5 A3 )s ,2 ).m p( [A ron ,t2 sed 2.0 goemiutil l( tp 0.1 0.1 T/T noit ma Dxl 1.5 t alan 2 = eoi Rt 1.9 c ps 1.0 ar 0.01 F 0 1 2 3 4 5 64080120 0 1 2 3 4 5 0.00 1 2 3 4 5 Time Delay (ps) GO photoreduction time (a.u.) GO photoreduction time (a.u.) FIG. 2. (a) ∆T/T relaxation kinetics at Eprobe = 1.3 eV accelerate with sequential GO photoreduction. Fits show two exponential lifetimes, with only the most oxidized samples requiring a third lifetime of τ3 = 61±2 ps.(b) The ∆T/T kinetics for Eprobe = 1.2 eV (open circles) relax faster than at 1.3 eV (closed circles). The rGO3 photoreduction stage most closely approximates the ml-graphene interband relaxation kinetics shown (dashed line). (c) For each probe energy, the τ1 lifetimes (top) are roughly constant, whereas the τ2 lifetime (bottom) decrease linearly ∼ 2.5× during with photoreduction to become even faster than ml-graphene. (d) Amplitudes (A1/2/3) of each lifetime component suggest a composition change with increasing amplitude from sp2 sub-lattice dynamics. The smallest A3 (blue) amplitude quickly decreases to zero as GO is reduced. states that have been previously observed in conjugated carbon systems .32,33 This is further supported by the qualitative increase in lattice defect states that is evident by increased emission in IR region of the PL spectra (see supplemental Fig. S2). Figures 2c-d contain the results of our exponential fit- ting lines shown in Fig. 1d and 2a-b (solid lines). The top panel shows the amplitude of the fast time compo- nent (∼0.4 ps) at 1.2 eV, 1.3 eV, and 1.8 eV, which accelerates only moderately as the GO samples are re- duced. The middle panel shows the amplitude of the second (τ2 ≈ 1−2.5 ps, pink) and third (τ3 >30 ps, blue) time components, which both decrease with reduction. Importantly, the slow time τ3 component goes to zero in the limit of heavy reduction and closely resembles the ml- graphene relaxation. The bottom panel of Fig. 2c shows the τ2 relaxation time of GO decreases roughly linearly with photoreduction time. At all probe energies, the τ2 relaxation time decreases with reduction, with rGO3,4,5 having lifetimes shorter than that of CVD graphene un- der the same optical conditions. The CVD ml-graphene (dashed line in Fig. 1-2) was fit to a τ2 =1.9 ps at 1.2 eV and 1.1 ps at 1.8 probe energies respectively. In most heavily oxygenated rGO samples, the longest τ3 ∼ 61 ps component comprises up to 16% of the total decay amplitude. Such samples contain many functional groups, however, the large band gap of the fully oxided regions is well outside the spectral range of both pump and probe laser energies. Instead, graphene quantum dots (GQD) create gapped sp2 molecule-like regions with size-tunable bandgaps that are resonant with our probe beam.22 For rGO3,4,5 samples, Fig. 2d shows that the τ3 time-component is zero for Eprobe < 1.3 eV, suggest- ing only graphene-like sp2 sublattice regions are relevant to the electronic dynamics throughout this near-infrared probe region. A. IV. ANALYSIS AND DISCUSSION rGO Fano Lineshape Absorption Analysis The transmission spectra in Fig. 1a, Fig. S2 and fitted absorption spectra in Fig. 3 all show lineshapes similar to ml-graphene throughout the NIR and IR spectral re- gions from ∼0.4 to 3.5 eV. The absorption maxima of both ml-graphene and rGO in Fig. 3 (black line) deviate from the tight-binding model prediction of the graphene van Hove singularity M-point resonance at ∼5.1 eV.34 Instead, the graphene absorption is best fit by a Fano 4PDF Image | Graphene Oxide Photoreduction Recovers Graphene
PDF Search Title:
Graphene Oxide Photoreduction Recovers GrapheneOriginal File Name Searched:
2301-13176.pdfDIY PDF Search: Google It | Yahoo | Bing
Salgenx Redox Flow Battery Technology: Power up your energy storage game with Salgenx Salt Water Battery. With its advanced technology, the flow battery provides reliable, scalable, and sustainable energy storage for utility-scale projects. Upgrade to a Salgenx flow battery today and take control of your energy future.
| CONTACT TEL: 608-238-6001 Email: greg@infinityturbine.com | RSS | AMP |