PDF Publication Title:
Text from PDF Page: 007
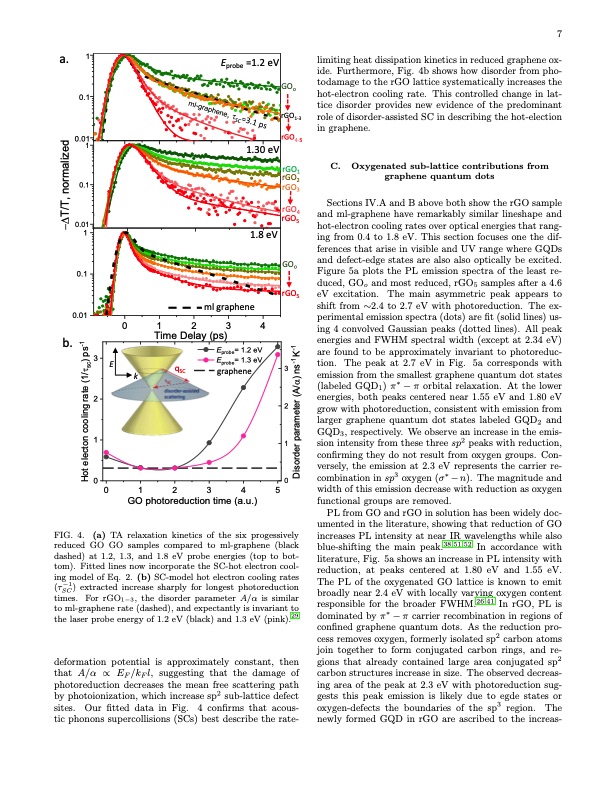
a. 1 0.1 0.01 d 1 e zila m r o 0.1 n FIG. 4. (a) TA relaxation kinetics of the six progessively reduced GO GO samples compared to ml-graphene (black dashed) at 1.2, 1.3, and 1.8 eV probe energies (top to bot- tom). Fitted lines now incorporate the SC-hot electron cool- ing model of Eq. 2. (b) SC-model hot electron cooling rates (τ−1) extracted increase sharply for longest photoreduction SC times. For rGO1−3, the disorder parameter A/α is similar to ml-graphene rate (dashed), and expectantly is invariant to the laser probe energy of 1.2 eV (black) and 1.3 eV (pink).29 deformation potential is approximately constant, then that A/α ∝ EF /kF l, suggesting that the damage of photoreduction decreases the mean free scattering path by photoionization, which increase sp2 sub-lattice defect sites. Our fitted data in Fig. 4 confirms that acous- tic phonons supercollisions (SCs) best describe the rate- limiting heat dissipation kinetics in reduced graphene ox- ide. Furthermore, Fig. 4b shows how disorder from pho- todamage to the rGO lattice systematically increases the hot-electron cooling rate. This controlled change in lat- tice disorder provides new evidence of the predominant role of disorder-assisted SC in describing the hot-election in graphene. Eprobe =1.2 eV 1.30 eV GOo rGO1-3 rGO4-5 rGO 1 rGO2 rGO 3 ,T Sections IV.A and B above both show the rGO sample / rGO T 4 and ml-graphene have remarkably similar lineshape and D rGO 5 - 0.01 hot-electron cooling rates over optical energies that rang- 1 1.8 eV ing from 0.4 to 1.8 eV. This section focuses one the dif- ferences that arise in visible and UV range where GQDs and defect-edge states are also also optically be excited. GOo 0.1 Figure 5a plots the PL emission spectra of the least re- duced, GOo and most reduced, rGO5 samples after a 4.6 rGO5 eV excitation. The main asymmetric peak appears to ml graphene shift from ∼2.4 to 2.7 eV with photoreduction. The ex- 0.01 perimental emission spectra (dots) are fit (solid lines) us- 01234 ing 4 convolved Gaussian peaks (dotted lines). All peak Time Delay (ps) energies and FWHM spectral width (except at 2.34 eV) b. 1- s 1- Eprobe= 1.2 eV are found to be approximately invariant to photoreduc- p)1K 3 E probe = 1.3 eV E - cs s tion. The peak at 2.7 eV in Fig. 5a corresponds with /n t q3 SC graphene 1) k emission from the smallest graphene quantum dot states (/a (labeled GQD ) π∗ − π orbital relaxation. At the lower et A 1 ar ( 2 r energies, both peaks centered near 1.55 eV and 1.80 eV get 2 grow with photoreduction, consistent with emission from niloem larger graphene quantum dot states labeled GQD and 2 oa c ra GQD3, respectively. We observe an increase in the emis- np 12 or 1 sion intensity from these three sp peaks with reduction, tce ed confirming they do not result from oxygen groups. Con- l et ros versely, the emission at 2.3 eV represents the carrier re- oiD H 00 combination in sp3 oxygen (σ∗ − n). The magnitude and 012345 width of this emission decrease with reduction as oxygen GO photoreduction time (a.u.) functional groups are removed. 7 C. Oxygenated sub-lattice contributions from graphene quantum dots PL from GO and rGO in solution has been widely doc- umented in the literature, showing that reduction of GO increases PL intensity at near IR wavelengths while also blue-shifting the main peak.38,51,52 In accordance with literature, Fig. 5a shows an increase in PL intensity with reduction, at peaks centered at 1.80 eV and 1.55 eV. The PL of the oxygenated GO lattice is known to emit broadly near 2.4 eV with locally varying oxygen content responsible for the broader FWHM.26,41 In rGO, PL is ∗ dominated by π − π carrier recombination in regions of confined graphene quantum dots. As the reduction pro- cess removes oxygen, formerly isolated sp2 carbon atoms join together to form conjugated carbon rings, and re- gions that already contained large area conjugated sp2 carbon structures increase in size. The observed decreas- ing area of the peak at 2.3 eV with photoreduction sug- gests this peak emission is likely due to egde states or oxygen-defects the boundaries of the sp3 region. The newly formed GQD in rGO are ascribed to the increas-PDF Image | Graphene Oxide Photoreduction Recovers Graphene
PDF Search Title:
Graphene Oxide Photoreduction Recovers GrapheneOriginal File Name Searched:
2301-13176.pdfDIY PDF Search: Google It | Yahoo | Bing
Salgenx Redox Flow Battery Technology: Power up your energy storage game with Salgenx Salt Water Battery. With its advanced technology, the flow battery provides reliable, scalable, and sustainable energy storage for utility-scale projects. Upgrade to a Salgenx flow battery today and take control of your energy future.
CONTACT TEL: 608-238-6001 Email: greg@infinityturbine.com (Standard Web Page)