PDF Publication Title:
Text from PDF Page: 008
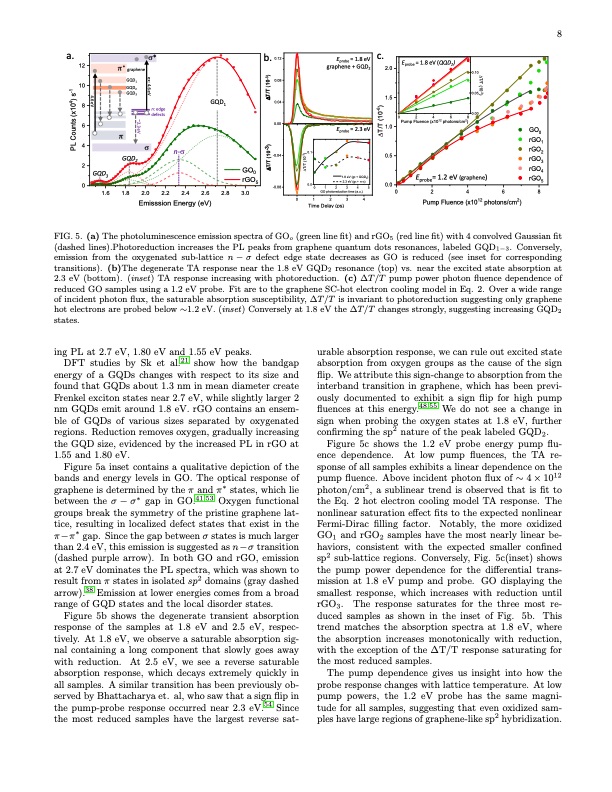
s* graphene GQD1 GQD2 GQD3 n-s GQD2 QD3 s n: edge defects GQD1 GO0 rGO5 FIG. 5. (a) The photoluminescence emission spectra of GOo (green line fit) and rGO5 (red line fit) with 4 convolved Gaussian fit (dashed lines).Photoreduction increases the PL peaks from graphene quantum dots resonances, labeled GQD1−3. Conversely, emission from the oxygenated sub-lattice n − σ defect edge state decreases as GO is reduced (see inset for corresponding transitions). (b)The degenerate TA response near the 1.8 eV GQD2 resonance (top) vs. near the excited state absorption at 2.3 eV (bottom). (inset) TA response increasing with photoreduction. (c) ∆T/T pump power photon fluence dependence of reduced GO samples using a 1.2 eV probe. Fit are to the graphene SC-hot electron cooling model in Eq. 2. Over a wide range of incident photon flux, the saturable absorption susceptibility, ∆T/T is invariant to photoreduction suggesting only graphene hot electrons are probed below ∼1.2 eV. (inset) Conversely at 1.8 eV the ∆T/T changes strongly, suggesting increasing GQD2 states. ing PL at 2.7 eV, 1.80 eV and 1.55 eV peaks. DFT studies by Sk et al.21 show how the bandgap energy of a GQDs changes with respect to its size and found that GQDs about 1.3 nm in mean diameter create Frenkel exciton states near 2.7 eV, while slightly larger 2 nm GQDs emit around 1.8 eV. rGO contains an ensem- ble of GQDs of various sizes separated by oxygenated regions. Reduction removes oxygen, gradually increasing the GQD size, evidenced by the increased PL in rGO at 1.55 and 1.80 eV. Figure 5a inset contains a qualitative depiction of the bands and energy levels in GO. The optical response of graphene is determined by the π and π∗ states, which lie between the σ − σ∗ gap in GO.41,53 Oxygen functional groups break the symmetry of the pristine graphene lat- tice, resulting in localized defect states that exist in the π−π∗ gap. Since the gap between σ states is much larger than 2.4 eV, this emission is suggested as n − σ transition (dashed purple arrow). In both GO and rGO, emission at 2.7 eV dominates the PL spectra, which was shown to result from π states in isolated sp2 domains (gray dashed arrow).38 Emission at lower energies comes from a broad range of GQD states and the local disorder states. Figure 5b shows the degenerate transient absorption response of the samples at 1.8 eV and 2.5 eV, respec- tively. At 1.8 eV, we observe a saturable absorption sig- nal containing a long component that slowly goes away with reduction. At 2.5 eV, we see a reverse saturable absorption response, which decays extremely quickly in all samples. A similar transition has been previously ob- served by Bhattacharya et. al, who saw that a sign flip in the pump-probe response occurred near 2.3 eV.54 Since the most reduced samples have the largest reverse sat- urable absorption response, we can rule out excited state absorption from oxygen groups as the cause of the sign flip. We attribute this sign-change to absorption from the interband transition in graphene, which has been previ- ously documented to exhibit a sign flip for high pump fluences at this energy.48,55 We do not see a change in sign when probing the oxygen states at 1.8 eV, further confirming the sp2 nature of the peak labeled GQD2. Figure 5c shows the 1.2 eV probe energy pump flu- ence dependence. At low pump fluences, the TA re- sponse of all samples exhibits a linear dependence on the pump fluence. Above incident photon flux of ∼ 4 × 10¹² photon/cm2, a sublinear trend is observed that is fit to the Eq. 2 hot electron cooling model TA response. The nonlinear saturation effect fits to the expected nonlinear Fermi-Dirac filling factor. Notably, the more oxidized GO1 and rGO2 samples have the most nearly linear be- haviors, consistent with the expected smaller confined sp2 sub-lattice regions. Conversely, Fig. 5c(inset) shows the pump power dependence for the differential trans- mission at 1.8 eV pump and probe. GO displaying the smallest response, which increases with reduction until rGO3. The response saturates for the three most re- duced samples as shown in the inset of Fig. 5b. This trend matches the absorption spectra at 1.8 eV, where the absorption increases monotonically with reduction, with the exception of the ∆T/T response saturating for the most reduced samples. The pump dependence gives us insight into how the probe response changes with lattice temperature. At low pump powers, the 1.2 eV probe has the same magni- tude for all samples, suggesting that even oxidized sam- ples have large regions of graphene-like sp2 hybridization. b. 8 a. 12 10 8 6 4 2 G b. 0.12 0.08 0.04 0.00 -0.04 -0.08 0.1 Eprobe = 1.8 eV graphene + GQD2 Eprobe = 2.3 eV 1.8 eV (gr.+ GQD2) c. 2.0 1.5 1.0 0.5 0.0 0 1.6 2.3 eV (gr.+ n-s) 0.00 1 2 3 4 5 GO photoreduction time (a.u.) 1 2 3 4 Time Delay (ps) 0 2 4 Pump Fluence (x1012 photons/cm2) 1.8 2.0 2.2 2.4 2.6 2.8 3.0 6 8 Emisssion Energy (eV) 0 DT/T (10-3) DT/T (10-3) DT/T (10-3) PL Counts (x104) s-1 DT/T (10-6) 4.6 eV Eprobe = 1.8 eV (QQD2) 0.05 0.00 02468 Pump Fluence (x1012 photons/cm2) 0.10 Eprobe= 1.2 eV (graphene) rGO5 GO0 rGO1 rGO2 rGO3 rGO4 DT/T (10-3) 𝜋∗ 𝜋 ex: 4.6 eV ~2.3 eVPDF Image | Graphene Oxide Photoreduction Recovers Graphene
PDF Search Title:
Graphene Oxide Photoreduction Recovers GrapheneOriginal File Name Searched:
2301-13176.pdfDIY PDF Search: Google It | Yahoo | Bing
Salgenx Redox Flow Battery Technology: Power up your energy storage game with Salgenx Salt Water Battery. With its advanced technology, the flow battery provides reliable, scalable, and sustainable energy storage for utility-scale projects. Upgrade to a Salgenx flow battery today and take control of your energy future.
| CONTACT TEL: 608-238-6001 Email: greg@infinityturbine.com | RSS | AMP |