PDF Publication Title:
Text from PDF Page: 006
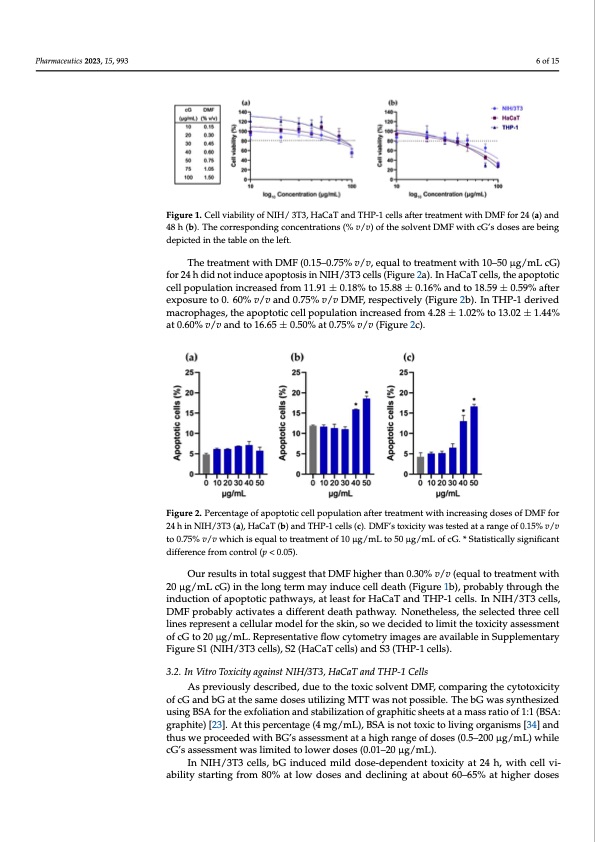
Pharmaceutics 2023, 15, 993 In the MTT assay, the treatment of cells with DMF showed a dose- and time-depend- In the MTT assay, the treatment of cells with DMF showed a dose- and time-depend- ent toxicity. Treatment with all concentrations of DMF up to 1.05% v/v (equal to treatment ent toxicity. Treatment with all concentrations of DMF up to 1.05% v/v (equal to treatment with 75 μg/mL cG) for 24 h did not significantly affect cells’ viability (Figure 1a). At 48 h, with 75 μg/mL cG) for 24 h did not significantly affect cells’ viability (Figure 1a). At 48 h, v/v (equal to treatment with 50 μg/mL cG) reduced viability to less than 80% (Figure 1b). v/v (equal to treatment with 50 μg/mL cG) reduced viability to less than 80% (Figure 1b). FFigiguurere11..CeelllvviaiabbiliiltiytyooffNIHIH//3T3,,HaCaTandTHP--1celllssafftteerrttrreeaattmeennttwitihthDMFFfoforr2244(a(a))aanndd Figure 1. Cell viability of NIH/ 3T3, HaCaT and THP-1 cells after treatment with DMF for 24 (a) and a significant decline in all cell populations was observed. DMF doses higher than 0.75% a significant decline in all cell populations was observed. DMF doses higher than 0.75% 48 h (b). The corresponding concentrations (% v/v) of the solvent DMF with cG’s doses are being 48 h (b). The corresponding concentrations (% v/v) of the solvent DMF with cG’s doses are being 48 h (b). The corresponding concentrations (% v/v) of the solvent DMF with cG’s doses are being depicted in the table on the left. depicted in the table on the left. depicted in the table on the left. TThheetrtereaatmtmeennt twwitihthDDMMFF(0(.01.51–50–.07.57%5%v/v/vv,,eeqquaalltototrtreeaatmtmeennt twitihth1100––5500μμgg//mLccG)) The treatment with DMF (0.15–0.75% v/v, equal to treatment with 10–50 μg/mL cG) foforr2244hhdididnontoitnidnudcuecaepaopotopstiossiins NinIHN/IH3T/3Tc3elclsel(lFsig(Fuirgeu2rae).2Ian).HInaCHaaTCcaeTllsc,etlhlse,atphoepatpootipc- 6 of 15 for 24 h did not induce apoptosis in NIH/3T3 cells (Figure 2a). In HaCaT cells, the apop- cteolltipcocpeulllaptoiopnuliantciorenasinedcrferaosmed1f1r.o9m1 ±110..9118%± 0to.181%5.8t8o±150.8.186%± 0a.n16d%toa1n8d.5t9o±180.5.599%± 0a.f5t9e%r totic cell population increased from 11.91 ± 0.18% to 15.88 ± 0.16% and to 18.59 ± 0.59% eaxfpteorseuxrpeotosu0r.e6t0o%0.v6/0%vavn/vda0n.7d50%.75v%/vvD/vMDFM,rFe,srpeespcteicvteivlyel(yFi(gFuigruer2eb2)b.)I.nInTTHHPP-1-1ddeerirviveedd after exposure to 0. 60% v/v and 0.75% v/v DMF, respectively (Figure 2b). In THP-1 derived maaccrroopphhaaggeess, ,ththeeaappoopptototitcicceclelllppooppuulaltaitoionninicnrceraesaesdedfrformom4.42.828±±11.0.022%%toto131.30.202±±11.4.44% macrophages, the apoptotic cell population increased from 4.28 ± 1.02% to 13.02 ± 1.44% aatt00.6.600%vv//v and to 16.65 ± 0..50%att0..75%v//vv(F(Figiguurere22cc).). at 0.60% v/v and to 16.65 ± 0.50% at 0.75% v/v (Figure 2c). FFigiguurere22..PPeercrceenntataggeeooffaappoopptototitciccceelllppooppuulalatitoionnaaftfeterrtrtreeaatmtmeennttwitihthininccrreeaassininggddoosseessooffDMFFfoforr Figure 2. Percentage of apoptotic cell population after treatment with increasing doses of DMF for 24 h in NIH/3T3 (a), HaCaT (b) and THP-1 cells (c). DMF’s toxicity was tested at a range of 0.15% 24 h in NIH/3T3 (a), HaCaT (b) and THP-1 cells (c). DMF’s toxicity was tested at a range of 0.15% v/v 24 h in NIH/3T3 (a), HaCaT (b) and THP-1 cells (c). DMF’s toxicity was tested at a range of 0.15% v/v to 0.75% v/v which is equal to treatment of 10 μg/mL to 50 μg/mL of cG. * Statistically significant tov/0v.7to5%0.7v5/%v wv/hviwchicsheqisueaqlutoalttroeattrmeaetnmteonft1o0fμ10g/μmg/LmtLot5o05μ0gμ/gm/mLLofocfGcG. *. *StSattaitsitsitciaclallylysisgignnifiifciacanntt difference from control (p < 0.05). ddififeferernencecefrforommcoconntrtorol (lp(p<<00.0.055).). Our results in total suggest that DMF higher than 0.30% v/v (equal to treatment with Our results in total suggest that DMF higher than 0.30% v/v (equal to treatment with Our results in total suggest that DMF higher than 0.30% v/v (equal to treatment with 20 μg/mL cG) in the long term may induce cell death (Figure 1b), probably through the 20 μg/mL cG) in the long term may induce cell death (Figure 1b), probably through the 20 μg/mL cG) in the long term may induce cell death (Figure 1b), probably through the induction of apoptotic pathways, at least for HaCaT and THP-1 cells. In NIH/3T3 cells, induction of apoptotic pathways, at least for HaCaT and THP-1 cells. In NIH/3T3 cells, induction of apoptotic pathways, at least for HaCaT and THP-1 cells. In NIH/3T3 cells, DMF probably activates a different death pathway. Nonetheless, the selected three cell DMF probably activates a different death pathway. Nonetheless, the selected three cell DMF probably activates a different death pathway. Nonetheless, the selected three cell lines represent a cellular model for the skin, so we decided to limit the toxicity assessment lines represent a cellular model for the skin, so we decided to limit the toxicity assessment lines represent a cellular model for the skin, so we decided to limit the toxicity assessment of cG to 20 μg/mL. Representative flow cytometry images are available in Supplementary of cG to 20 μg/mL. Representative flow cytometry images are available in Supplementary of cG to 20 μg/mL. Representative flow cytometry images are available in Supplementary FFigiguurreeSS11(N(NIHIH//3T3cells),,S2(HaCaTcellls)andS3((THP--1cellls)).. Figure S1 (NIH/3T3 cells), S2 (HaCaT cells) and S3 (THP-1 cells). 3.2. In Vitro Toxicity against NIH/3T3, HaCaT and THP-1 Cells 3.2. In Vitro Toxicity against NIH/3T3, HaCaT and THP-1 Cells 3.2. In Vitro Toxicity against NIH/3T3, HaCaT and THP-1 Cells As previously described, due to the toxic solvent DMF, comparing the cytotoxicity As previously described, due to the toxic solvent DMF, comparing the cytotoxicity of As previously described, due to the toxic solvent DMF, comparing the cytotoxicity of of cG and bG at the same doses utilizing MTT was not possible. The bG was synthesized cG and bG at the same doses utilizing MTT was not possible. The bG was synthesized cG and bG at the same doses utilizing MTT was not possible. The bG was synthesized using BSA for the exfoliation and stabilization of graphitic sheets at a mass ratio of 1:1 (BSA: graphite) [23]. At this percentage (4 mg/mL), BSA is not toxic to living organisms [34] and thus we proceeded with BG’s assessment at a high range of doses (0.5–200 μg/mL) while cG’s assessment was limited to lower doses (0.01–20 μg/mL). In NIH/3T3 cells, bG induced mild dose-dependent toxicity at 24 h, with cell vi- ability starting from 80% at low doses and declining at about 60–65% at higher dosesPDF Image | Green Exfoliation of Graphene
PDF Search Title:
Green Exfoliation of GrapheneOriginal File Name Searched:
pharmaceutics-15-00993.pdfDIY PDF Search: Google It | Yahoo | Bing
Salgenx Redox Flow Battery Technology: Power up your energy storage game with Salgenx Salt Water Battery. With its advanced technology, the flow battery provides reliable, scalable, and sustainable energy storage for utility-scale projects. Upgrade to a Salgenx flow battery today and take control of your energy future.
CONTACT TEL: 608-238-6001 Email: greg@infinityturbine.com (Standard Web Page)