PDF Publication Title:
Text from PDF Page: 006
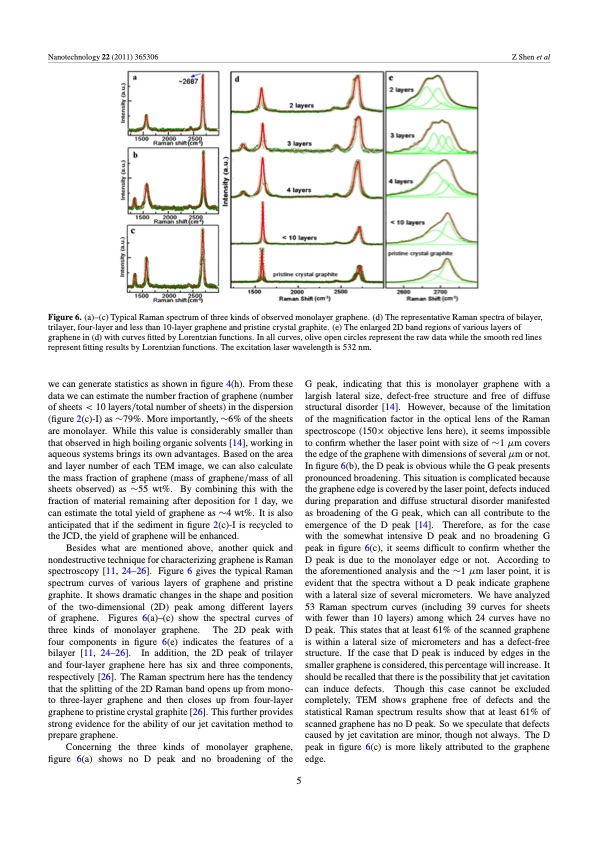
Nanotechnology 22 (2011) 365306 Z Shen et al Figure 6. (a)–(c) Typical Raman spectrum of three kinds of observed monolayer graphene. (d) The representative Raman spectra of bilayer, trilayer, four-layer and less than 10-layer graphene and pristine crystal graphite. (e) The enlarged 2D band regions of various layers of graphene in (d) with curves fitted by Lorentzian functions. In all curves, olive open circles represent the raw data while the smooth red lines represent fitting results by Lorentzian functions. The excitation laser wavelength is 532 nm. we can generate statistics as shown in figure 4(h). From these data we can estimate the number fraction of graphene (number of sheets < 10 layers/total number of sheets) in the dispersion (figure 2(c)-I) as ∼79%. More importantly, ∼6% of the sheets are monolayer. While this value is considerably smaller than that observed in high boiling organic solvents [14], working in aqueous systems brings its own advantages. Based on the area and layer number of each TEM image, we can also calculate the mass fraction of graphene (mass of graphene/mass of all sheets observed) as ∼55 wt%. By combining this with the fraction of material remaining after deposition for 1 day, we can estimate the total yield of graphene as ∼4 wt%. It is also anticipated that if the sediment in figure 2(c)-I is recycled to the JCD, the yield of graphene will be enhanced. Besides what are mentioned above, another quick and nondestructive technique for characterizing graphene is Raman spectroscopy [11, 24–26]. Figure 6 gives the typical Raman spectrum curves of various layers of graphene and pristine graphite. It shows dramatic changes in the shape and position of the two-dimensional (2D) peak among different layers of graphene. Figures 6(a)–(c) show the spectral curves of three kinds of monolayer graphene. The 2D peak with four components in figure 6(e) indicates the features of a bilayer [11, 24–26]. In addition, the 2D peak of trilayer and four-layer graphene here has six and three components, respectively [26]. The Raman spectrum here has the tendency that the splitting of the 2D Raman band opens up from mono- to three-layer graphene and then closes up from four-layer graphene to pristine crystal graphite [26]. This further provides strong evidence for the ability of our jet cavitation method to prepare graphene. Concerning the three kinds of monolayer graphene, figure 6(a) shows no D peak and no broadening of the G peak, indicating that this is monolayer graphene with a largish lateral size, defect-free structure and free of diffuse structural disorder [14]. However, because of the limitation of the magnification factor in the optical lens of the Raman spectroscope (150× objective lens here), it seems impossible to confirm whether the laser point with size of ∼1 μm covers the edge of the graphene with dimensions of several μm or not. In figure 6(b), the D peak is obvious while the G peak presents pronounced broadening. This situation is complicated because the graphene edge is covered by the laser point, defects induced during preparation and diffuse structural disorder manifested as broadening of the G peak, which can all contribute to the emergence of the D peak [14]. Therefore, as for the case with the somewhat intensive D peak and no broadening G peak in figure 6(c), it seems difficult to confirm whether the D peak is due to the monolayer edge or not. According to the aforementioned analysis and the ∼1 μm laser point, it is evident that the spectra without a D peak indicate graphene with a lateral size of several micrometers. We have analyzed 53 Raman spectrum curves (including 39 curves for sheets with fewer than 10 layers) among which 24 curves have no D peak. This states that at least 61% of the scanned graphene is within a lateral size of micrometers and has a defect-free structure. If the case that D peak is induced by edges in the smaller graphene is considered, this percentage will increase. It should be recalled that there is the possibility that jet cavitation can induce defects. Though this case cannot be excluded completely, TEM shows graphene free of defects and the statistical Raman spectrum results show that at least 61% of scanned graphene has no D peak. So we speculate that defects caused by jet cavitation are minor, though not always. The D peak in figure 6(c) is more likely attributed to the graphene edge. 5PDF Image | Preparation of graphene by jet cavitation
PDF Search Title:
Preparation of graphene by jet cavitationOriginal File Name Searched:
graphene-by-jet-cavitation.pdfDIY PDF Search: Google It | Yahoo | Bing
Salgenx Redox Flow Battery Technology: Power up your energy storage game with Salgenx Salt Water Battery. With its advanced technology, the flow battery provides reliable, scalable, and sustainable energy storage for utility-scale projects. Upgrade to a Salgenx flow battery today and take control of your energy future.
| CONTACT TEL: 608-238-6001 Email: greg@infinityturbine.com | RSS | AMP |