PDF Publication Title:
Text from PDF Page: 007
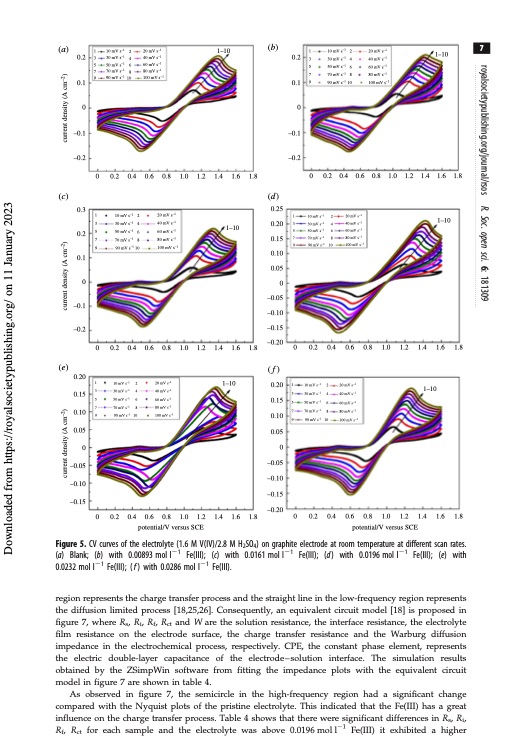
(a) 1 3 5 7 9 10 mV s–1 30 mV s–1 50 mV s–1 70 mV s–1 90 mV s–1 2 4 6 8 10 20 mV s–1 40 mV s–1 60 mV s–1 80 mV s–1 100 mV s–1 1–10 (b) 1 10 mV s–1 2 3 30 mV s–1 4 5 50 mV s–1 6 7 70 mV s–1 8 9 90 mV s–1 10 20 mV s–1 40 mV s–1 1–10 60 mV s–1 80 mV s–1 100 mV s–1 7 (c) 0.3 0.2 0.1 0 –0.1 –0.2 (e) 0.20 0.15 0.10 0.05 1 3 5 7 9 0 1 3 5 7 9 10 mV s–1 30 mV s–1 50 mV s–1 70 mV s–1 90 mV s–1 2 4 6 8 10 20 mV s–1 40 mV s–1 60 mV s–1 80 mV s–1 100 mV s–1 0.8 20 mV s–1 40 mV s–1 60 mV s–1 80 mV s–1 –1 1 10 mV s–1 2 3 30 mV s–1 4 5 50 mV s–1 6 7 70 mV s–1 8 9 90 mV s–1 10 20 mV s–1 40 mV s–1 60 mV s–1 80 mV s–1 100 mV s–1 1–10 0.2 0.1 –0.1 –0.2 0.2 0.1 00 0 0.2 0.4 0.6 0.8 1.0 1.2 1.4 1.6 1.8 –0.1 –0.2 (d) 0.25 0.20 0.15 0.10 0.05 0 –0.05 –0.10 –0.15 –0.20 (f) 0.20 0.15 0.10 0.05 0 0.2 0.4 0.6 0.8 1.0 1.2 1.4 1.6 1.8 –0.05 –0.10 –0.15 –0.05 –0.10 –0.15 –0.20 0.2 0.4 0.6 1.0 1.2 1.4 1.6 1–10 1.8 0 0.2 1 10 mV s–1 3 30 mV s–1 5 50 mV s–1 7 70 mV s–1 9 90 mV s–1 0.4 0.6 0.8 1.0 1.2 1.4 1.6 1.8 100 mV s 00 0 0.2 0.4 0.6 0.8 1.0 1.2 1.4 1.6 1.8 potential/V versus SCE 0 0.2 0.4 0.6 0.8 1.0 1.2 1.4 1.6 1.8 potential/V versus SCE 1–10 10 mV s–1 30 mV s–1 50 mV s–1 70 mV s–1 –1 90 mV s 2 4 6 8 10 2 20 mV s–1 4 40 mV s–1 6 60 mV s–1 8 80 mV s–1 10 100 mV s–1 1–10 Figure 5. CV curves of the electrolyte (1.6 M V(IV)/2.8 M H2SO4) on graphite electrode at room temperature at different scan rates. (a) Blank; (b) with 0.00893 mol l21 Fe(III); (c) with 0.0161 mol l21 Fe(III); (d) with 0.0196 mol l21 Fe(III); (e) with 0.0232 mol l21 Fe(III); ( f ) with 0.0286 mol l21 Fe(III). region represents the charge transfer process and the straight line in the low-frequency region represents the diffusion limited process [18,25,26]. Consequently, an equivalent circuit model [18] is proposed in figure 7, where Rs, Ri, Rf, Rct and W are the solution resistance, the interface resistance, the electrolyte film resistance on the electrode surface, the charge transfer resistance and the Warburg diffusion impedance in the electrochemical process, respectively. CPE, the constant phase element, represents the electric double-layer capacitance of the electrode – solution interface. The simulation results obtained by the ZSimpWin software from fitting the impedance plots with the equivalent circuit model in figure 7 are shown in table 4. As observed in figure 7, the semicircle in the high-frequency region had a significant change compared with the Nyquist plots of the pristine electrolyte. This indicated that the Fe(III) has a great influence on the charge transfer process. Table 4 shows that there were significant differences in Rs, Ri, Rf, Rct for each sample and the electrolyte was above 0.0196moll21 Fe(III) it exhibited a higher royalsocietypublishing.org/journal/rsos R. Soc. open sci. 6: 181309 Downloaded from https://royalsocietypublishing.org/ on 11 January 2023 current density (A cm–2) current density (A cm–2) current density (A cm–2)PDF Image | Effect of Fe3 positive electrolyte vanadium redox flow
PDF Search Title:
Effect of Fe3 positive electrolyte vanadium redox flowOriginal File Name Searched:
rsos-181309.pdfDIY PDF Search: Google It | Yahoo | Bing
Salgenx Redox Flow Battery Technology: Salt water flow battery technology with low cost and great energy density that can be used for power storage and thermal storage. Let us de-risk your production using our license. Our aqueous flow battery is less cost than Tesla Megapack and available faster. Redox flow battery. No membrane needed like with Vanadium, or Bromine. Salgenx flow battery
| CONTACT TEL: 608-238-6001 Email: greg@salgenx.com | RSS | AMP |