PDF Publication Title:
Text from PDF Page: 074
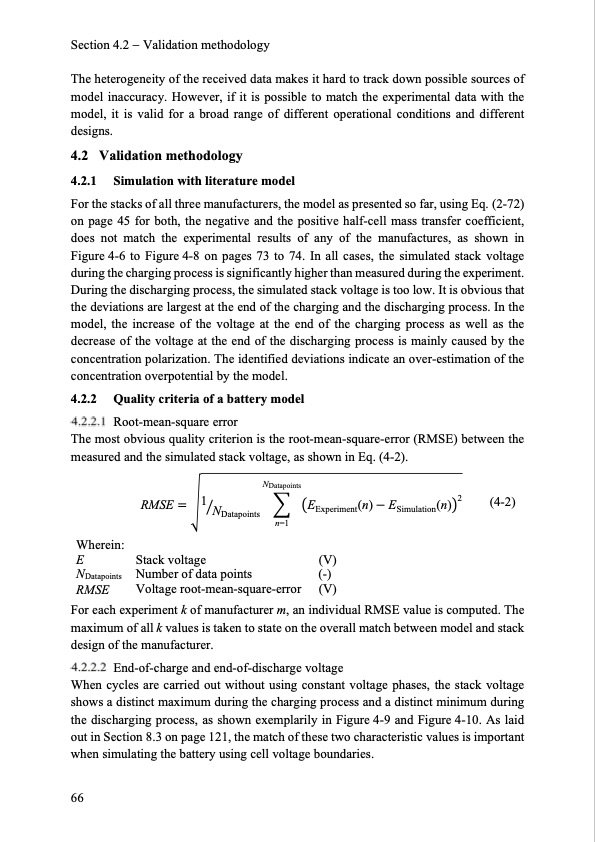
Section 4.2 Validation methodology The heterogeneity of the received data makes it hard to track down possible sources of model inaccuracy. However, if it is possible to match the experimental data with the model, it is valid for a broad range of different operational conditions and different designs. 4.2 Validation methodology 4.2.1 Simulation with literature model For the stacks of all three manufacturers, the model as presented so far, using Eq. (2-72) on page 45 for both, the negative and the positive half-cell mass transfer coefficient, does not match the experimental results of any of the manufactures, as shown in Figure 4-6 to Figure 4-8 on pages 73 to 74. In all cases, the simulated stack voltage during the charging process is significantly higher than measured during the experiment. During the discharging process, the simulated stack voltage is too low. It is obvious that the deviations are largest at the end of the charging and the discharging process. In the model, the increase of the voltage at the end of the charging process as well as the decrease of the voltage at the end of the discharging process is mainly caused by the concentration polarization. The identified deviations indicate an over-estimation of the concentration overpotential by the model. 4.2.2 Quality criteria of a battery model Root-mean-square error The most obvious quality criterion is the root-mean-square-error (RMSE) between the measured and the simulated stack voltage, as shown in Eq. (4-2). NDatapoints n=1 Wherein: E Stack voltage NDatapoints Number of data points RMSE Voltage root-mean-square-error EExperiment(n) ESimulation(n)2 (V) (-) (V) .RMSE 1NDatapoints (4-2) For each experiment k of manufacturer m, an individual RMSE value is computed. The maximum of all k values is taken to state on the overall match between model and stack design of the manufacturer. End-of-charge and end-of-discharge voltage When cycles are carried out without using constant voltage phases, the stack voltage shows a distinct maximum during the charging process and a distinct minimum during the discharging process, as shown exemplarily in Figure 4-9 and Figure 4-10. As laid out in Section 8.3 on page 121, the match of these two characteristic values is important when simulating the battery using cell voltage boundaries. 66PDF Image | Model-based Design Vanadium Redox Flow Batteries

PDF Search Title:
Model-based Design Vanadium Redox Flow BatteriesOriginal File Name Searched:
10-5445IR1000070670.pdfDIY PDF Search: Google It | Yahoo | Bing
Salgenx Redox Flow Battery Technology: Salt water flow battery technology with low cost and great energy density that can be used for power storage and thermal storage. Let us de-risk your production using our license. Our aqueous flow battery is less cost than Tesla Megapack and available faster. Redox flow battery. No membrane needed like with Vanadium, or Bromine. Salgenx flow battery
| CONTACT TEL: 608-238-6001 Email: greg@salgenx.com | RSS | AMP |