PDF Publication Title:
Text from PDF Page: 048
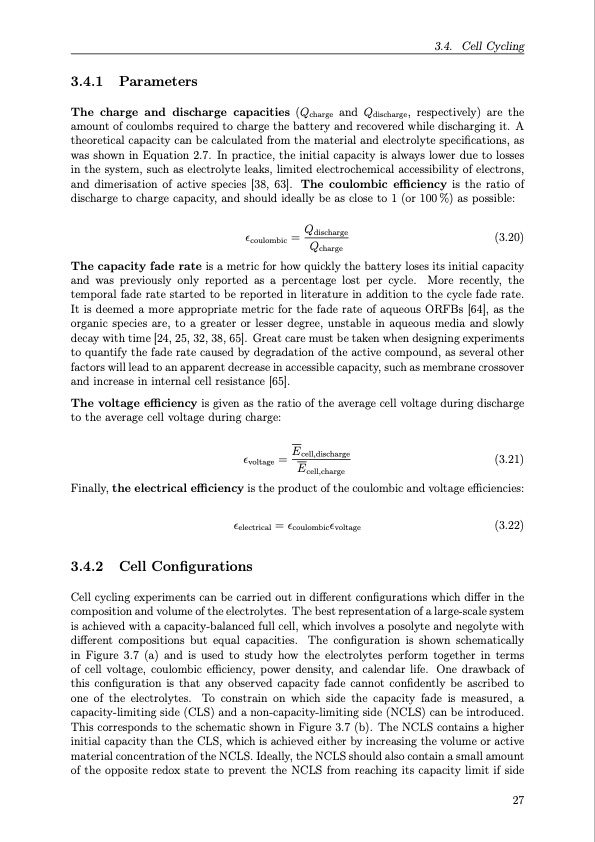
3.4. Cell Cycling 3.4.1 Parameters The charge and discharge capacities (Qcharge and Qdischarge, respectively) are the amount of coulombs required to charge the battery and recovered while discharging it. A theoretical capacity can be calculated from the material and electrolyte specifications, as was shown in Equation 2.7. In practice, the initial capacity is always lower due to losses in the system, such as electrolyte leaks, limited electrochemical accessibility of electrons, and dimerisation of active species [38, 63]. The coulombic efficiency is the ratio of discharge to charge capacity, and should ideally be as close to 1 (or 100 %) as possible: εcoulombic = Qdischarge (3.20) Qcharge The capacity fade rate is a metric for how quickly the battery loses its initial capacity and was previously only reported as a percentage lost per cycle. More recently, the temporal fade rate started to be reported in literature in addition to the cycle fade rate. It is deemed a more appropriate metric for the fade rate of aqueous ORFBs [64], as the organic species are, to a greater or lesser degree, unstable in aqueous media and slowly decay with time [24, 25, 32, 38, 65]. Great care must be taken when designing experiments to quantify the fade rate caused by degradation of the active compound, as several other factors will lead to an apparent decrease in accessible capacity, such as membrane crossover and increase in internal cell resistance [65]. The voltage efficiency is given as the ratio of the average cell voltage during discharge to the average cell voltage during charge: εvoltage = Ecell,discharge (3.21) E cell,charge Finally, the electrical efficiency is the product of the coulombic and voltage efficiencies: εelectrical = εcoulombicεvoltage (3.22) 3.4.2 Cell Configurations Cell cycling experiments can be carried out in different configurations which differ in the composition and volume of the electrolytes. The best representation of a large-scale system is achieved with a capacity-balanced full cell, which involves a posolyte and negolyte with different compositions but equal capacities. The configuration is shown schematically in Figure 3.7 (a) and is used to study how the electrolytes perform together in terms of cell voltage, coulombic efficiency, power density, and calendar life. One drawback of this configuration is that any observed capacity fade cannot confidently be ascribed to one of the electrolytes. To constrain on which side the capacity fade is measured, a capacity-limiting side (CLS) and a non-capacity-limiting side (NCLS) can be introduced. This corresponds to the schematic shown in Figure 3.7 (b). The NCLS contains a higher initial capacity than the CLS, which is achieved either by increasing the volume or active material concentration of the NCLS. Ideally, the NCLS should also contain a small amount of the opposite redox state to prevent the NCLS from reaching its capacity limit if side 27PDF Image | Organic Redox Flow Batteries 2023

PDF Search Title:
Organic Redox Flow Batteries 2023Original File Name Searched:
PhD_thesis_final_dorhoff_4_.pdfDIY PDF Search: Google It | Yahoo | Bing
Salgenx Redox Flow Battery Technology: Salt water flow battery technology with low cost and great energy density that can be used for power storage and thermal storage. Let us de-risk your production using our license. Our aqueous flow battery is less cost than Tesla Megapack and available faster. Redox flow battery. No membrane needed like with Vanadium, or Bromine. Salgenx flow battery
| CONTACT TEL: 608-238-6001 Email: greg@salgenx.com | RSS | AMP |