PDF Publication Title:
Text from PDF Page: 129
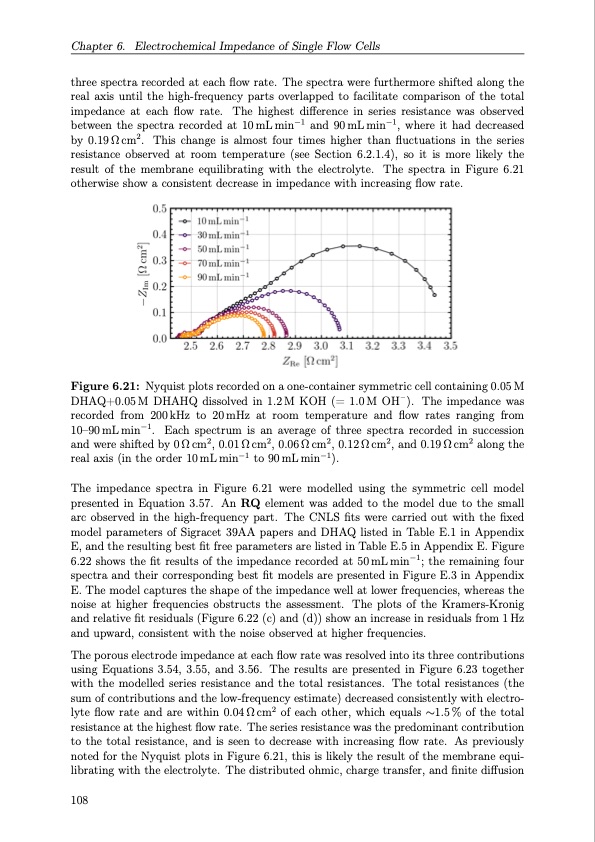
Chapter 6. Electrochemical Impedance of Single Flow Cells three spectra recorded at each flow rate. The spectra were furthermore shifted along the real axis until the high-frequency parts overlapped to facilitate comparison of the total impedance at each flow rate. The highest difference in series resistance was observed between the spectra recorded at 10mLmin−1 and 90mLmin−1, where it had decreased by 0.19 Ω cm2 . This change is almost four times higher than fluctuations in the series resistance observed at room temperature (see Section 6.2.1.4), so it is more likely the result of the membrane equilibrating with the electrolyte. The spectra in Figure 6.21 otherwise show a consistent decrease in impedance with increasing flow rate. Figure 6.21: Nyquist plots recorded on a one-container symmetric cell containing 0.05 M DHAQ+0.05M DHAHQ dissolved in 1.2M KOH (= 1.0M OH–). The impedance was recorded from 200kHz to 20mHz at room temperature and flow rates ranging from 10–90mLmin−1. Each spectrum is an average of three spectra recorded in succession andwereshiftedby0Ωcm2,0.01Ωcm2,0.06Ωcm2,0.12Ωcm2,and0.19Ωcm2 alongthe real axis (in the order 10 mL min−1 to 90 mL min−1). The impedance spectra in Figure 6.21 were modelled using the symmetric cell model presented in Equation 3.57. An RQ element was added to the model due to the small arc observed in the high-frequency part. The CNLS fits were carried out with the fixed model parameters of Sigracet 39AA papers and DHAQ listed in Table E.1 in Appendix E, and the resulting best fit free parameters are listed in Table E.5 in Appendix E. Figure 6.22 shows the fit results of the impedance recorded at 50mLmin−1; the remaining four spectra and their corresponding best fit models are presented in Figure E.3 in Appendix E. The model captures the shape of the impedance well at lower frequencies, whereas the noise at higher frequencies obstructs the assessment. The plots of the Kramers-Kronig and relative fit residuals (Figure 6.22 (c) and (d)) show an increase in residuals from 1 Hz and upward, consistent with the noise observed at higher frequencies. The porous electrode impedance at each flow rate was resolved into its three contributions using Equations 3.54, 3.55, and 3.56. The results are presented in Figure 6.23 together with the modelled series resistance and the total resistances. The total resistances (the sum of contributions and the low-frequency estimate) decreased consistently with electro- lyte flow rate and are within 0.04Ωcm2 of each other, which equals ∼1.5% of the total resistance at the highest flow rate. The series resistance was the predominant contribution to the total resistance, and is seen to decrease with increasing flow rate. As previously noted for the Nyquist plots in Figure 6.21, this is likely the result of the membrane equi- librating with the electrolyte. The distributed ohmic, charge transfer, and finite diffusion 108PDF Image | Organic Redox Flow Batteries 2023
PDF Search Title:
Organic Redox Flow Batteries 2023Original File Name Searched:
PhD_thesis_final_dorhoff_4_.pdfDIY PDF Search: Google It | Yahoo | Bing
Salgenx Redox Flow Battery Technology: Salt water flow battery technology with low cost and great energy density that can be used for power storage and thermal storage. Let us de-risk your production using our license. Our aqueous flow battery is less cost than Tesla Megapack and available faster. Redox flow battery. No membrane needed like with Vanadium, or Bromine. Salgenx flow battery
| CONTACT TEL: 608-238-6001 Email: greg@salgenx.com | RSS | AMP |