PDF Publication Title:
Text from PDF Page: 006
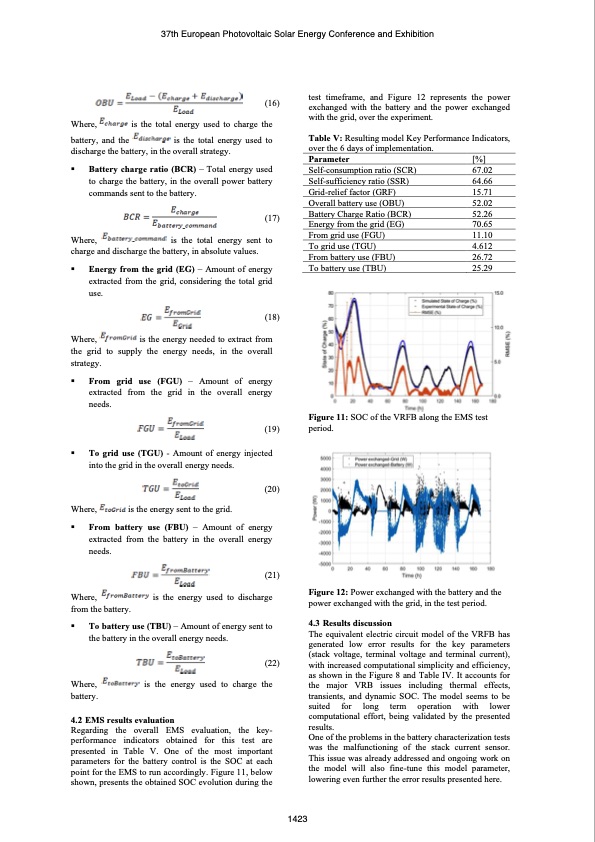
battery, and the discharge the battery, in the overall strategy. Parameter Self-consumption ratio (SCR) Self-sufficiency ratio (SSR) Grid-relief factor (GRF) Overall battery use (OBU) Battery Charge Ratio (BCR) Energy from the grid (EG) From grid use (FGU) To grid use (TGU) From battery use (FBU) To battery use (TBU) [%] 67.02 64.66 15.71 52.02 52.26 70.65 11.10 4.612 26.72 25.29 37th European Photovoltaic Solar Energy Conference and Exhibition Where, (16) is the total energy used to charge the test timeframe, and Figure 12 represents the power exchanged with the battery and the power exchanged with the grid, over the experiment. Table V: Resulting model Key Performance Indicators, over the 6 days of implementation. is the total energy used to ▪ Battery charge ratio (BCR) – Total energy used to charge the battery, in the overall power battery commands sent to the battery. (17) Where, is the total energy sent to charge and discharge the battery, in absolute values. ▪ Energy from the grid (EG) – Amount of energy extracted from the grid, considering the total grid use. (18) Where, is the energy needed to extract from the grid to supply the energy needs, in the overall strategy. ▪ From grid use (FGU) – Amount of energy extracted from the grid in the overall energy needs. (19) ▪ To grid use (TGU) - Amount of energy injected into the grid in the overall energy needs. (20) Where, is the energy sent to the grid. ▪ From battery use (FBU) – Amount of energy extracted from the battery in the overall energy needs. (21) Where, is the energy used to discharge from the battery. ▪ Tobatteryuse(TBU)–Amountofenergysentto the battery in the overall energy needs. (22) Where, is the energy used to charge the battery. 4.2 EMS results evaluation Regarding the overall EMS evaluation, the key- performance indicators obtained for this test are presented in Table V. One of the most important parameters for the battery control is the SOC at each point for the EMS to run accordingly. Figure 11, below shown, presents the obtained SOC evolution during the Figure 11: SOC of the VRFB along the EMS test period. Figure 12: Power exchanged with the battery and the power exchanged with the grid, in the test period. 4.3 Results discussion The equivalent electric circuit model of the VRFB has generated low error results for the key parameters (stack voltage, terminal voltage and terminal current), with increased computational simplicity and efficiency, as shown in the Figure 8 and Table IV. It accounts for the major VRB issues including thermal effects, transients, and dynamic SOC. The model seems to be suited for long term operation with lower computational effort, being validated by the presented results. One of the problems in the battery characterization tests was the malfunctioning of the stack current sensor. This issue was already addressed and ongoing work on the model will also fine-tune this model parameter, lowering even further the error results presented here. 1423PDF Image | VANADIUM REDOX FLOW BATTERY MODELLING
PDF Search Title:
VANADIUM REDOX FLOW BATTERY MODELLINGOriginal File Name Searched:
Vanadium-Redox-Flow-Battery-Modelling.pdfDIY PDF Search: Google It | Yahoo | Bing
Salgenx Redox Flow Battery Technology: Salt water flow battery technology with low cost and great energy density that can be used for power storage and thermal storage. Let us de-risk your production using our license. Our aqueous flow battery is less cost than Tesla Megapack and available faster. Redox flow battery. No membrane needed like with Vanadium, or Bromine. Salgenx flow battery
| CONTACT TEL: 608-238-6001 Email: greg@salgenx.com | RSS | AMP |