PDF Publication Title:
Text from PDF Page: 005
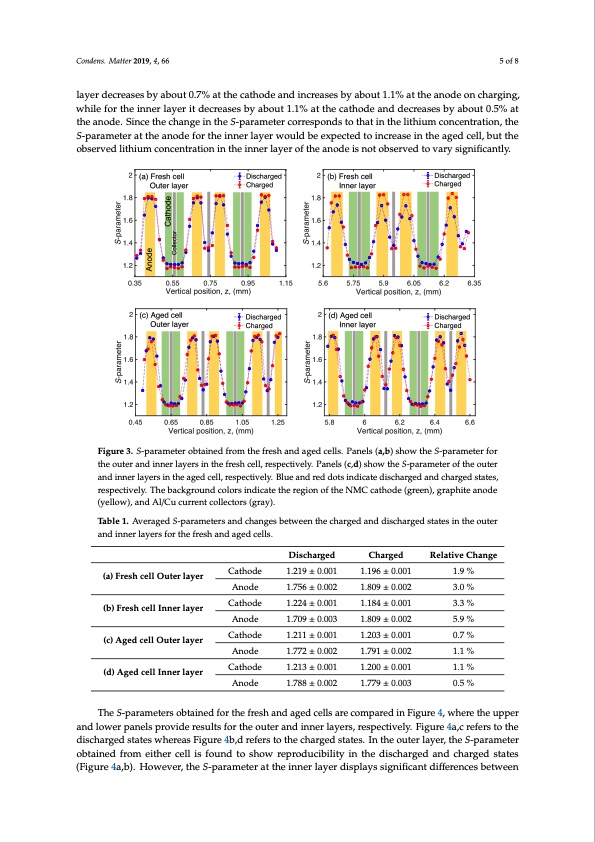
Condens. Matter 2019, 4, x FOR PEER REVIEW 5 of 8 outer layer decreases by about 1.9% at the cathode and increases by about 3.0% at the anode on charging. The average S-parameter of the inner layer decreases by about 3.3% at the cathode and increases by about 5.9% at the anode on charging. Thus, in the fresh cell, the values of the S-parameter Condens. Matter 2019, 4, 66 5 of 8 show that a larger level of lithiation occurs in the inner layer. In contrast, in the aged cell, the average S-parameter of the outer layer decreases by about 0.7% at the cathode and increases by about 1.1% at the anode on charging, while for the inner layer it decreases by about 1.1% at the cathode and layer decreases by about 0.7% at the cathode and increases by about 1.1% at the anode on charging, decreases by about 0.5% at the anode. Since the change in the S-parameter corresponds to that in the while for the inner layer it decreases by about 1.1% at the cathode and decreases by about 0.5% at lithium concentration, the S-parameter at the anode for the inner layer would be expected to increase the anode. Since the change in the S-parameter corresponds to that in the lithium concentration, the in the aged cell, but the observed lithium concentration in the inner layer of the anode is not observed S-parameter at the anode for the inner layer would be expected to increase in the aged cell, but the to vary significantly. observed lithium concentration in the inner layer of the anode is not observed to vary significantly. FFigiguurere3.3S.-Sp-aprarmametetreorbotabitnaeindefdrofmromthethfresfhreasnhdaangdedagceldls.cePlalsn.ePlsa(nae,bls)s(ha)owantdhe(bS)-psahroawmetheerfSo-r pthaeraomuteetreranfodritnhneeorulateyrerasnidnitnhneefrelashyecreslli,nretshpeefcrteivshelcye. lPl,arneeslpse(ct,div)eslhyo. PwatnheelsS(-cp)aaranmde(dte)rsohfotwhethouetSe-r panardaimnneteerrlaoyfetrhseinotuhteragaenddceinlln,reersplaeycetirvseilny.tBhleueaagnedrceedlld,oretspinedctiicvaetelyd.iBsclhuaergaendarnedcdhoatrsgeidndsitcaatetes, dreiscpheacrtigveedlya.nTdhechbarcgkegdrosutantdesc,orelosrpseicntidvieclayt.eTtherbeagcikognrouf tnhdecNoMlorCs cinadthicoadte(tghreeereng),iognraopfhtihteaNnModCe c(yatehllodwe),(garnedenA),l/gCruapchuirtrenantocodlele(cyteolrlsow(g)r,aayn).d Al/Cu current collectors (gray). Table 1. Averaged S-parameters and changes between the charged and discharged states in the outer Table 1. Averaged S-parameters and changes between the charged and discharged states in the outer and inner layers for the fresh and aged cells. and inner layers for the fresh and aged cells. (a) Fresh cell Outer layer Cathode 1.9 % (a) Fresh cell Outer layer Anode 3.0 % (b) Fresh cell Inner layer Anode Cathode 3.0 % 3.3 % (b) Fresh cell Inner layer (c) Aged cell Outer layer Anode 5.9 % (c) Aged cell Outer layer Cathode 1.772 0.002 1.772 ± 0.002 1.791 0.002 1.791 ± 0.002 0.7 % (d) Aged cell Inner layer Cathode 1.1 % (d) Aged cell Inner layer Cathode 1.1 % Cathode 1.219 ± 0.001 1.219 0.001 1.756 ± 0.002 1.756 0.002 1.12.2244±00.0.001 1.709 0.003 1.709 ± 0.003 1.211 0.001 1.211 ± 0.001 1.196 ± 0.001 1.196 0.001 1.809 ± 0.002 1.809 0.002 1.1.81484±00.0.001 1.809 0.002 1.809 ± 0.002 1.203 0.001 1.203 ± 0.001 1.9 % Anode 5.9 % Cathode 0.7 % Anode 1.1 % Anode 1.213 0.001 1.213 ± 0.001 1.788 0.002 1.200 0.001 1.200 ± 0.001 1.779 0.003 1.1 % Anode 0.5 % Anode 1.788 ± 0.002 1.779 ± 0.003 0.5 % Discharged Charged Relative Change Discharged Charged Relative change The S-parameters obtained for the fresh and aged cells are compared in Figure 4, where the uppeTrhaendS-lpoawraemrpeatenreslsobptraoinveidefroerstuhletsfrfeosrhthaendouatgeerdancedllisnanrercloamyeprasr,erdesipneFctigivuerley4.F,wighuerree4tah,ecurepfperesr and lower panels provide results for the outer and inner layers, respectively. Figure 4a,c refers to the discharged states whereas Figure 4b,d refers to the charged states. In the outer layer, the S-parameter obtained from either cell is found to show reproducibility in the discharged and charged states (Figure 4a,b). However, the S-parameter at the inner layer displays significant differences betweenPDF Image | High-Energy X-Ray Compton Scattering Imaging of 18650-Type Lithium-Ion Battery
PDF Search Title:
High-Energy X-Ray Compton Scattering Imaging of 18650-Type Lithium-Ion BatteryOriginal File Name Searched:
condensedmatter-04-00066-v2.pdfDIY PDF Search: Google It | Yahoo | Bing
Sulfur Deposition on Carbon Nanofibers using Supercritical CO2 Sulfur Deposition on Carbon Nanofibers using Supercritical CO2. Gamma sulfur also known as mother of pearl sulfur and nacreous sulfur... More Info
CO2 Organic Rankine Cycle Experimenter Platform The supercritical CO2 phase change system is both a heat pump and organic rankine cycle which can be used for those purposes and as a supercritical extractor for advanced subcritical and supercritical extraction technology. Uses include producing nanoparticles, precious metal CO2 extraction, lithium battery recycling, and other applications... More Info
| CONTACT TEL: 608-238-6001 Email: greg@infinityturbine.com | RSS | AMP |