PDF Publication Title:
Text from PDF Page: 003
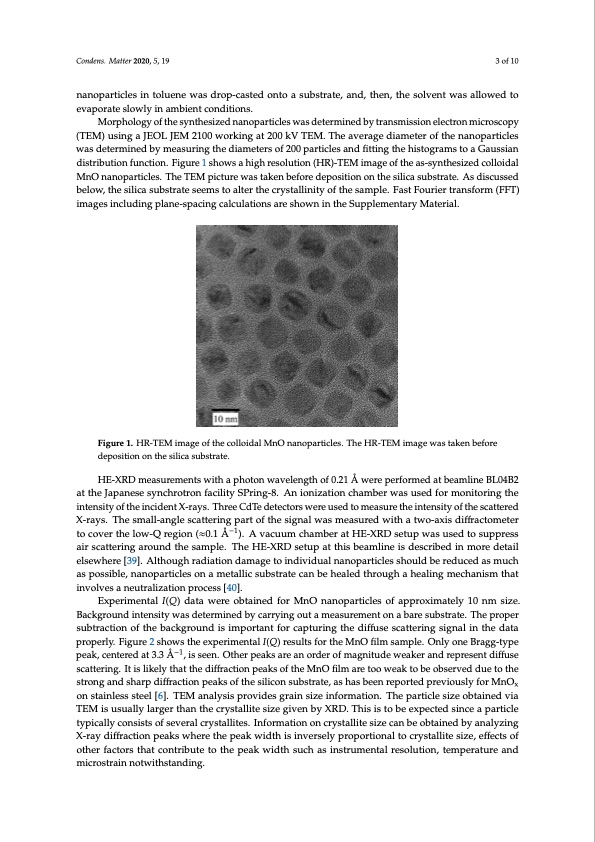
Condens. Matter 2020, 5, 19 3 of 10 Condens. Matter 2019, 4, x FOR PEER REVIEW 3 of 10 nanoparticles in toluene was drop-casted onto a substrate, and, then, the solvent was allowed to of the nanoparticles in toluene was drop-casted onto a substrate, and, then, the solvent was allowed evaporate slowly in ambient conditions. to evaporate slowly in ambient conditions. Morphology of the synthesized nanoparticles was determined by transmission electron microscopy Morphology of the synthesized nanoparticles was determined by transmission electron (TEM) using a JEOL JEM 2100 working at 200 kV TEM. The average diameter of the nanoparticles microscopy (TEM) using a JEOL JEM 2100 working at 200 kV TEM. The average diameter of the Commented [M4]: Is it was determined by measuring the diameters of 200 particles and fitting the histograms to a Gaussianthe manufacturer and the nanoparticles was determined by measuring the diameters of 200 particles and fitting the histograms distributotioanGfauunscsitaionnd.isFtirgiburteio1nsfhuonwctisona.hFiighures1oslhuotiwosna(HhiRg)h-TreEsMoluitmioang(eHoRf)-tThEeMasi-msyangethoefsitzhedasc-olloidalCommented [IH5]: Plea synthesized colloidal MnO nanoparticles. The TEM picture was taken before deposition on the silica MnO nanoparticles. The TEM picture was taken before deposition on the silica substrate. As discussed substrate. As discussed below, the silica substrate seems to alter the crystallinity of the sample. Fast below, the silica substrate seems to alter the crystallinity of the sample. Fast Fourier transform (FFT) Fourier transform (FFT) images including plane-spacing calculations are shown in the images including plane-spacing calculations are shown in the Supplementary Material. Supplementary Material. Figure 1. HR-TEM image of the colloidal MnO nanoparticles. The HR-TEM image was taken before Figure 1. HR-TEM image of the colloidal MnO nanoparticles. The HR-TEM image was taken before deposition on the silica substrate. deposition on the silica substrate. HE-XRD measurements with a photon wavelength of 0.21 Å were performed at beamline HE-XRD measurements with a photon wavelength of 0.21 Å were performed at beamline BL04B2 BL04B2 at the Japanese synchrotron facility SPring-8. An ionization chamber was used for monitoring attheJtahpeaintesnesistynofcthreoitnrcoidnefnatcXil-irtaysS.PTrhirneeg-C8d.TAendeitoecntoizrsatwioenrecuhseadmtboemrewasausreutshedinftoenrsmityoonfitoheringthe intensitsycaotftetrheedinXc-ridayesn.tTXh-erasyms.alTl-hanregeleCsdcTatetedrientgecptoarst woferteheuseigdntaol mwaesasmureeastuhredintweinthsitayotwfoth-aexsiscattered diffractometer to cover the low-Q region (0.1 Å–1). A vacuum chamber at HE-XRD setup was used X-rays. The small-angle scattering part of the signal was measured with a two-axis diffractometer to suppress air scattering around−t1he sample. The HE-XRD setup at this beamline is described in more to cover the low-Q region (≈0.1 Å ). A vacuum chamber at HE-XRD setup was used to suppress detail elsewhere [39]. Although radiation damage to individual nanoparticles should be reduced as air scattering around the sample. The HE-XRD setup at this beamline is described in more detail much as possible, nanoparticles on a metallic substrate can be healed through a healing mechanism elsewhere [39]. Although radiation damage to individual nanoparticles should be reduced as much that involves a neutralization process [40]. as possible,ExnpaenroimpeanrttailclIe(Qs)odnataamwetraelolibctasiunbedstfroarteMcnaOn nbaenhopearlteicdletshorfouapgphroaxihmeatleilnyg10mnemchsainzei.sm that involveBsaackngerouutnradlinztaetniosintypwraoscdeestser[m40in].ed by carrying out a measurement on a bare substrate. The proper subtraction of the background is important for capturing the diffuse scattering signal in the data Experimental I(Q) data were obtained for MnO nanoparticles of approximately 10 nm size. properly. Figure 2 shows the experimental I(Q) results for the MnO film sample. Only one Bragg- Background intensity was determined by carrying out a measurement on a bare substrate. The proper type peak, centered at 3.3 Å–1, is seen. Other peaks are an order of magnitude weaker and represent subtraction of the background is important for capturing the diffuse scattering signal in the data diffuse scattering. It is likely that the diffraction peaks of the MnO film are too weak to be observed properly. Figure 2 shows the experimental I(Q) results for the MnO film sample. Only one Bragg-type due to the strong and sharp diffraction peaks of the silicon substrate, as has been reported previously −1 peak,cefonrteMrendOaxto3n.3stÅainle,sissteenl.[6O].thTeErMpeaankalsysairseparnovoidrdesergorafinmasigzneiitnufdoremwateiaokn.erThaendparretpicrlesseinzetdiffuse scatterionbgt.aiInteidsvliikaeTlEyMthiastutshuealdlyifflarragcetriothnanpethaekcsroysfttahlleiteMsinzOegfiivlemnbayreXtRoDo.wTheiaskisttobeeoxbpsecrtvededsindcueetothe a particle typically consists of several crystallites. Information on crystallite size can be obtained by strong and sharp diffraction peaks of the silicon substrate, as has been reported previously for MnOx analyzing X-ray diffraction peaks where the peak width is inversely proportional to crystallite size, on stainless steel [6]. TEM analysis provides grain size information. The particle size obtained via TEM is usually larger than the crystallite size given by XRD. This is to be expected since a particle typically consists of several crystallites. Information on crystallite size can be obtained by analyzing X-ray diffraction peaks where the peak width is inversely proportional to crystallite size, effects of other factors that contribute to the peak width such as instrumental resolution, temperature and microstrain notwithstanding. aPDF Image | Structure of Manganese Oxide Nanoparticles Extracted via Pair Distribution Functions
PDF Search Title:
Structure of Manganese Oxide Nanoparticles Extracted via Pair Distribution FunctionsOriginal File Name Searched:
condensedmatter-05-00019-v2.pdfDIY PDF Search: Google It | Yahoo | Bing
Sulfur Deposition on Carbon Nanofibers using Supercritical CO2 Sulfur Deposition on Carbon Nanofibers using Supercritical CO2. Gamma sulfur also known as mother of pearl sulfur and nacreous sulfur... More Info
CO2 Organic Rankine Cycle Experimenter Platform The supercritical CO2 phase change system is both a heat pump and organic rankine cycle which can be used for those purposes and as a supercritical extractor for advanced subcritical and supercritical extraction technology. Uses include producing nanoparticles, precious metal CO2 extraction, lithium battery recycling, and other applications... More Info
| CONTACT TEL: 608-238-6001 Email: greg@infinityturbine.com | RSS | AMP |