PDF Publication Title:
Text from PDF Page: 004
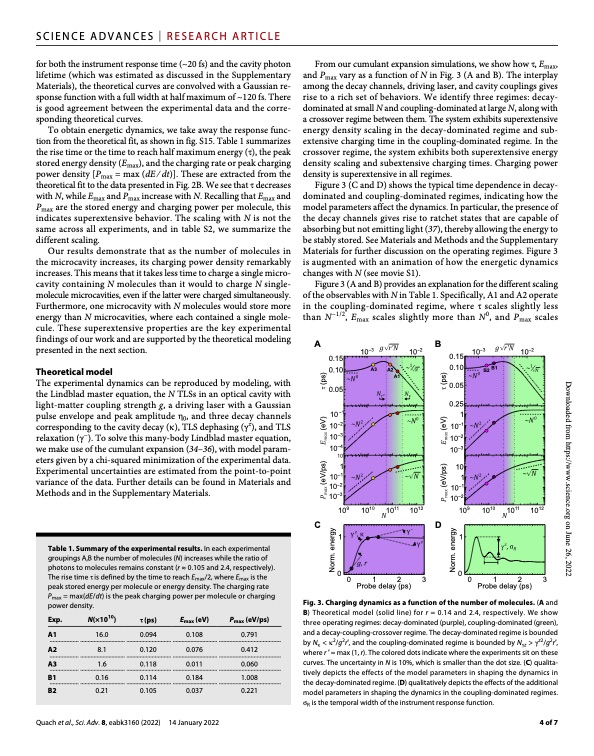
SCIENCE ADVANCES | RESEARCH ARTICLE for both the instrument response time (~20 fs) and the cavity photon lifetime (which was estimated as discussed in the Supplementary Materials), the theoretical curves are convolved with a Gaussian re- sponse function with a full width at half maximum of ~120 fs. There is good agreement between the experimental data and the corre- sponding theoretical curves. To obtain energetic dynamics, we take away the response func- tion from the theoretical fit, as shown in fig. S15. Table 1 summarizes the rise time or the time to reach half maximum energy (), the peak stored energy density (Emax), and the charging rate or peak charging power density [Pmax = max (dE ∕ dt)]. These are extracted from the theoretical fit to the data presented in Fig. 2B. We see that decreases with N, while Emax and Pmax increase with N. Recalling that Emax and Pmax are the stored energy and charging power per molecule, this indicates superextensive behavior. The scaling with N is not the same across all experiments, and in table S2, we summarize the different scaling. Our results demonstrate that as the number of molecules in the microcavity increases, its charging power density remarkably increases. This means that it takes less time to charge a single micro- cavity containing N molecules than it would to charge N single- molecule microcavities, even if the latter were charged simultaneously. Furthermore, one microcavity with N molecules would store more energy than N microcavities, where each contained a single mole- cule. These superextensive properties are the key experimental findings of our work and are supported by the theoretical modeling presented in the next section. From our cumulant expansion simulations, we show how , Emax, and Pmax vary as a function of N in Fig. 3 (A and B). The interplay among the decay channels, driving laser, and cavity couplings gives rise to a rich set of behaviors. We identify three regimes: decay- dominated at small N and coupling-dominated at large N, along with a crossover regime between them. The system exhibits superextensive energy density scaling in the decay-dominated regime and sub- extensive charging time in the coupling-dominated regime. In the crossover regime, the system exhibits both superextensive energy density scaling and subextensive charging times. Charging power density is superextensive in all regimes. Figure 3 (C and D) shows the typical time dependence in decay- dominated and coupling-dominated regimes, indicating how the model parameters affect the dynamics. In particular, the presence of the decay channels gives rise to ratchet states that are capable of absorbing but not emitting light (37), thereby allowing the energy to be stably stored. See Materials and Methods and the Supplementary Materials for further discussion on the operating regimes. Figure 3 is augmented with an animation of how the energetic dynamics changes with N (see movie S1). Figure 3 (A and B) provides an explanation for the different scaling of the observables with N in Table 1. Specifically, A1 and A2 operate in the coupling-dominated regime, where scales slightly less than N−1/2, Emax scales slightly more than N0, and Pmax scales Theoretical model 0.10 The experimental dynamics can be reproduced by modeling, with the Lindblad master equation, the N TLSs in an optical cavity with 0.05 light-matter coupling strength g, a driving laser with a Gaussian A1 0.10 B2 B1 0.05 0.25 1 10- 1 10- 2 10- 3 10 1 10- 1 10- 2 109 1010 pulse envelope and peak amplitude 0, and three decay channels 10-1 corresponding to the cavity decay (), TLS dephasing (z), and TLS 10- 2 relaxation (−). To solve this many-body Lindblad master equation, 10- 3 we make use of the cumulant expansion (34–36), with model param- 10- 4 eters given by a chi-squared minimization of the experimental data. 1 Experimental uncertainties are estimated from the point-to-point 10- 1 variance of the data. Further details can be found in Materials and 10- 2 Methods and in the Supplementary Materials. 10- 3 Table 1. Summary of the experimental results. In each experimental groupings A,B the number of molecules (N) increases while the ratio of photons to molecules remains constant (r ≈ 0.105 and 2.4, respectively). The rise time is defined by the time to reach Emax/2, where Emax is the peak stored energy per molecule or energy density. The charging rate Pmax = max(dE/dt) is the peak charging power per molecule or charging power density. 00123 00123 Probe delay (ps) Probe delay (ps) Fig. 3. Charging dynamics as a function of the number of molecules. (A and B) Theoretical model (solid line) for r = 0.14 and 2.4, respectively. We show three operating regimes: decay-dominated (purple), coupling-dominated (green), and a decay-coupling-crossover regime. The decay-dominated regime is bounded by N < 2/g2r′, and the coupling-dominated regime is bounded by Nz > z2/g2r′, where r ′ = max (1, r). The colored dots indicate where the experiments sit on these curves. The uncertainty in N is 10%, which is smaller than the dot size. (C) qualita- tively depicts the effects of the model parameters in shaping the dynamics in the decay-dominated regime. (D) qualitatively depicts the effects of the additional model parameters in shaping the dynamics in the coupling-dominated regimes. R is the temporal width of the instrument response function. Exp. N(×1010) A1 16.0 A2 8.1 A3 1.6 B1 0.16 B2 0.21 (ps) 0.094 0.120 0.118 0.114 0.105 Emax (eV) 0.108 0.076 0.011 0.184 0.037 Pmax (eV/ps) 0.791 0.412 0.060 1.008 0.221 Quach et al., Sci. Adv. 8, eabk3160 (2022) 14 January 2022 4 of 7 A 0.15 10-3 10-2 A3 A2 B 10-3 10-2 0.15 Norm. energy (eV/ps) (eV) (ps) Norm. energy (eV/ps) (eV) (ps) 109 1010 1011 1012 1011 1012 CD 11 Downloaded from https://www.science.org on June 26, 2022PDF Image | Superabsorption organic microcavity Toward a quantum battery
PDF Search Title:
Superabsorption organic microcavity Toward a quantum batteryOriginal File Name Searched:
sciadvabk3160.pdfDIY PDF Search: Google It | Yahoo | Bing
Sulfur Deposition on Carbon Nanofibers using Supercritical CO2 Sulfur Deposition on Carbon Nanofibers using Supercritical CO2. Gamma sulfur also known as mother of pearl sulfur and nacreous sulfur... More Info
CO2 Organic Rankine Cycle Experimenter Platform The supercritical CO2 phase change system is both a heat pump and organic rankine cycle which can be used for those purposes and as a supercritical extractor for advanced subcritical and supercritical extraction technology. Uses include producing nanoparticles, precious metal CO2 extraction, lithium battery recycling, and other applications... More Info
| CONTACT TEL: 608-238-6001 Email: greg@infinityturbine.com | RSS | AMP |