PDF Publication Title:
Text from PDF Page: 059
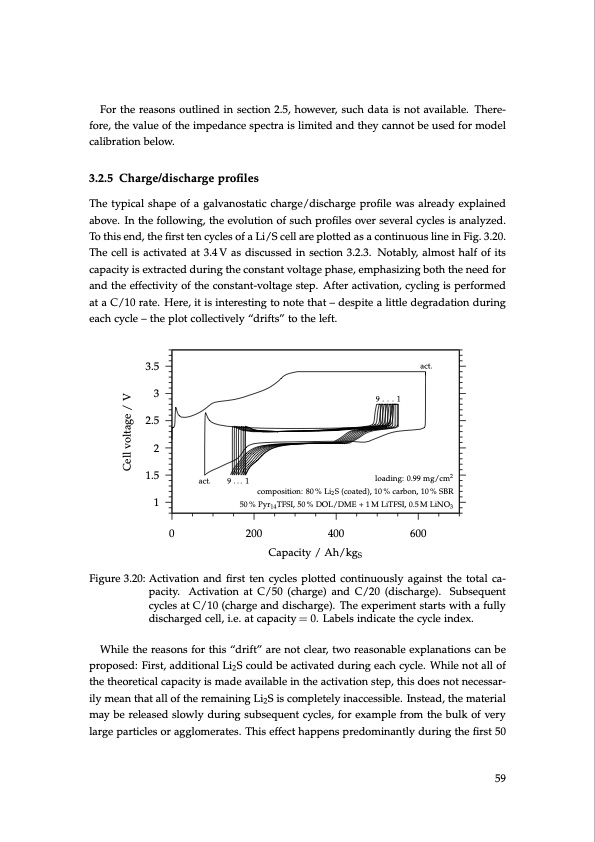
For the reasons outlined in section 2.5, however, such data is not available. There- fore, the value of the impedance spectra is limited and they cannot be used for model calibration below. 3.2.5 Charge/discharge profiles The typical shape of a galvanostatic charge/discharge profile was already explained above. In the following, the evolution of such profiles over several cycles is analyzed. To this end, the first ten cycles of a Li/S cell are plotted as a continuous line in Fig. 3.20. The cell is activated at 3.4 V as discussed in section 3.2.3. Notably, almost half of its capacity is extracted during the constant voltage phase, emphasizing both the need for and the effectivity of the constant-voltage step. After activation, cycling is performed at a C/10 rate. Here, it is interesting to note that – despite a little degradation during each cycle – the plot collectively “drifts” to the left. 3.5 3 2.5 2 1.5 1 Figure 3.20: Activation and first ten cycles plotted continuously against the total ca- pacity. Activation at C/50 (charge) and C/20 (discharge). Subsequent cycles at C/10 (charge and discharge). The experiment starts with a fully discharged cell, i.e. at capacity = 0. Labels indicate the cycle index. While the reasons for this “drift” are not clear, two reasonable explanations can be proposed: First, additional Li2S could be activated during each cycle. While not all of the theoretical capacity is made available in the activation step, this does not necessar- ily mean that all of the remaining Li2S is completely inaccessible. Instead, the material may be released slowly during subsequent cycles, for example from the bulk of very large particles or agglomerates. This effect happens predominantly during the first 50 act. 9...1 loading: 0.99 mg/cm2 composition: 80 % Li2 S (coated), 10 % carbon, 10 % SBR 50 % Pyr14 TFSI, 50 % DOL/DME + 1 M LiTFSI, 0.5 M LiNO3 9...1 act. 0 200 400 600 Capacity / Ah/kgS 59 Cell voltage / VPDF Image | Lithium-Sulfur Battery: Design, Characterization, and Physically-based Modeling
PDF Search Title:
Lithium-Sulfur Battery: Design, Characterization, and Physically-based ModelingOriginal File Name Searched:
Dissertation_David_N._Fronczek_The_Lithium_Sulfur_Battery.pdfDIY PDF Search: Google It | Yahoo | Bing
Sulfur Deposition on Carbon Nanofibers using Supercritical CO2 Sulfur Deposition on Carbon Nanofibers using Supercritical CO2. Gamma sulfur also known as mother of pearl sulfur and nacreous sulfur... More Info
CO2 Organic Rankine Cycle Experimenter Platform The supercritical CO2 phase change system is both a heat pump and organic rankine cycle which can be used for those purposes and as a supercritical extractor for advanced subcritical and supercritical extraction technology. Uses include producing nanoparticles, precious metal CO2 extraction, lithium battery recycling, and other applications... More Info
| CONTACT TEL: 608-238-6001 Email: greg@infinityturbine.com | RSS | AMP |