PDF Publication Title:
Text from PDF Page: 060
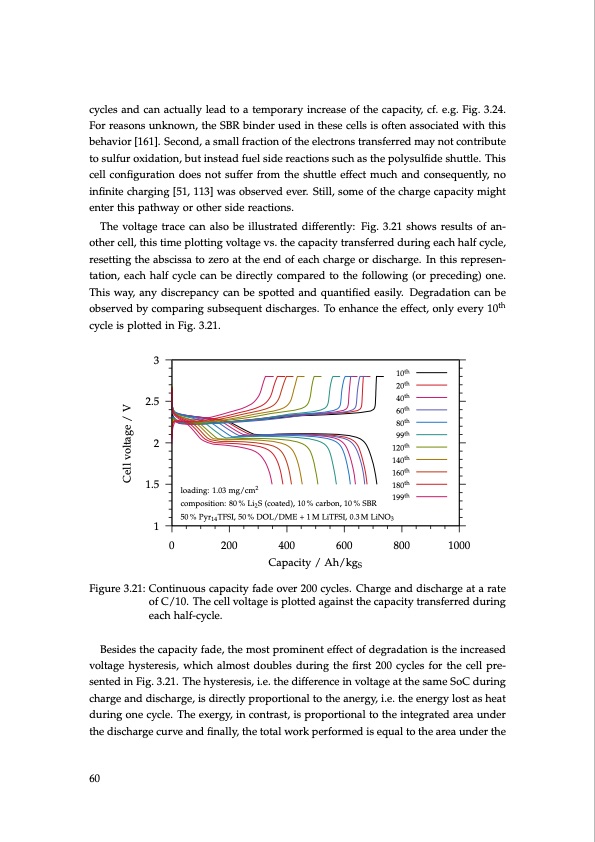
cycles and can actually lead to a temporary increase of the capacity, cf. e.g. Fig. 3.24. For reasons unknown, the SBR binder used in these cells is often associated with this behavior [161]. Second, a small fraction of the electrons transferred may not contribute to sulfur oxidation, but instead fuel side reactions such as the polysulfide shuttle. This cell configuration does not suffer from the shuttle effect much and consequently, no infinite charging [51, 113] was observed ever. Still, some of the charge capacity might enter this pathway or other side reactions. The voltage trace can also be illustrated differently: Fig. 3.21 shows results of an- other cell, this time plotting voltage vs. the capacity transferred during each half cycle, resetting the abscissa to zero at the end of each charge or discharge. In this represen- tation, each half cycle can be directly compared to the following (or preceding) one. This way, any discrepancy can be spotted and quantified easily. Degradation can be observed by comparing subsequent discharges. To enhance the effect, only every 10th cycle is plotted in Fig. 3.21. 3 2.5 2 1.5 1 10th 20th 40th 60th 80th 99th 120th 140th 160th 180th 199th loading: 1.03 mg/cm2 composition: 80 % Li2 S (coated), 10 % carbon, 10 % SBR 50 % Pyr14 TFSI, 50 % DOL/DME + 1 M LiTFSI, 0.3 M LiNO3 0 200 400 Capacity / Ah/kgS Figure 3.21: Continuous capacity fade over 200 cycles. Charge and discharge at a rate of C/10. The cell voltage is plotted against the capacity transferred during each half-cycle. Besides the capacity fade, the most prominent effect of degradation is the increased voltage hysteresis, which almost doubles during the first 200 cycles for the cell pre- sented in Fig. 3.21. The hysteresis, i.e. the difference in voltage at the same SoC during charge and discharge, is directly proportional to the anergy, i.e. the energy lost as heat during one cycle. The exergy, in contrast, is proportional to the integrated area under the discharge curve and finally, the total work performed is equal to the area under the 60 600 800 1000 Cell voltage / VPDF Image | Lithium-Sulfur Battery: Design, Characterization, and Physically-based Modeling
PDF Search Title:
Lithium-Sulfur Battery: Design, Characterization, and Physically-based ModelingOriginal File Name Searched:
Dissertation_David_N._Fronczek_The_Lithium_Sulfur_Battery.pdfDIY PDF Search: Google It | Yahoo | Bing
Sulfur Deposition on Carbon Nanofibers using Supercritical CO2 Sulfur Deposition on Carbon Nanofibers using Supercritical CO2. Gamma sulfur also known as mother of pearl sulfur and nacreous sulfur... More Info
CO2 Organic Rankine Cycle Experimenter Platform The supercritical CO2 phase change system is both a heat pump and organic rankine cycle which can be used for those purposes and as a supercritical extractor for advanced subcritical and supercritical extraction technology. Uses include producing nanoparticles, precious metal CO2 extraction, lithium battery recycling, and other applications... More Info
| CONTACT TEL: 608-238-6001 Email: greg@infinityturbine.com | RSS | AMP |