PDF Publication Title:
Text from PDF Page: 061
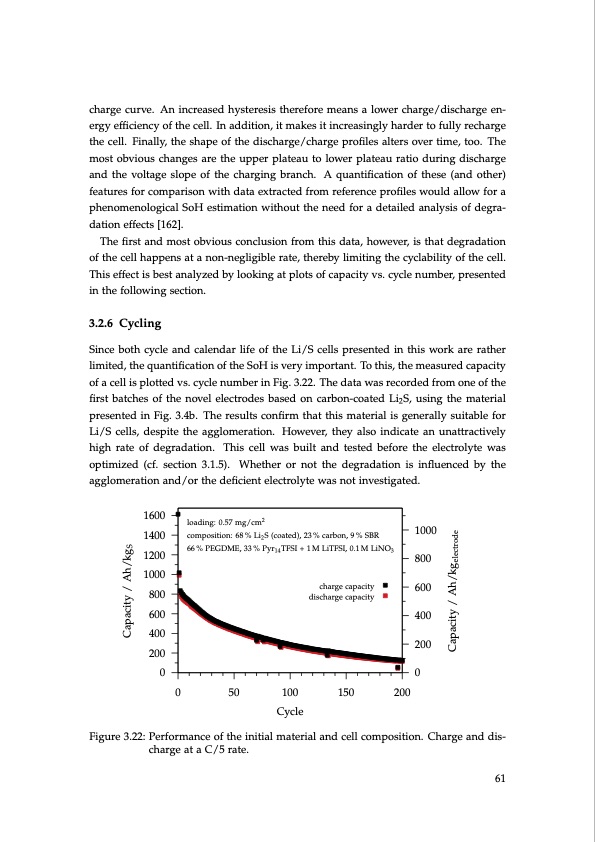
charge curve. An increased hysteresis therefore means a lower charge/discharge en- ergy efficiency of the cell. In addition, it makes it increasingly harder to fully recharge the cell. Finally, the shape of the discharge/charge profiles alters over time, too. The most obvious changes are the upper plateau to lower plateau ratio during discharge and the voltage slope of the charging branch. A quantification of these (and other) features for comparison with data extracted from reference profiles would allow for a phenomenological SoH estimation without the need for a detailed analysis of degra- dation effects [162]. The first and most obvious conclusion from this data, however, is that degradation of the cell happens at a non-negligible rate, thereby limiting the cyclability of the cell. This effect is best analyzed by looking at plots of capacity vs. cycle number, presented in the following section. 3.2.6 Cycling Since both cycle and calendar life of the Li/S cells presented in this work are rather limited, the quantification of the SoH is very important. To this, the measured capacity of a cell is plotted vs. cycle number in Fig. 3.22. The data was recorded from one of the first batches of the novel electrodes based on carbon-coated Li2S, using the material presented in Fig. 3.4b. The results confirm that this material is generally suitable for Li/S cells, despite the agglomeration. However, they also indicate an unattractively high rate of degradation. This cell was built and tested before the electrolyte was optimized (cf. section 3.1.5). Whether or not the degradation is influenced by the agglomeration and/or the deficient electrolyte was not investigated. loading: 0.57 mg/cm2 composition: 68 % Li2 S (coated), 23 % carbon, 9 % SBR 66 % PEGDME, 33 % Pyr14 TFSI + 1 M LiTFSI, 0.1 M LiNO3 charge capacity discharge capacity 1600 1400 1200 1000 800 600 400 200 1000 800 600 400 200 00 0 50 100 150 200 Cycle Figure 3.22: Performance of the initial material and cell composition. Charge and dis- charge at a C/5 rate. 61 Capacity / Ah/kgS Capacity / Ah/kgelectrodePDF Image | Lithium-Sulfur Battery: Design, Characterization, and Physically-based Modeling
PDF Search Title:
Lithium-Sulfur Battery: Design, Characterization, and Physically-based ModelingOriginal File Name Searched:
Dissertation_David_N._Fronczek_The_Lithium_Sulfur_Battery.pdfDIY PDF Search: Google It | Yahoo | Bing
Sulfur Deposition on Carbon Nanofibers using Supercritical CO2 Sulfur Deposition on Carbon Nanofibers using Supercritical CO2. Gamma sulfur also known as mother of pearl sulfur and nacreous sulfur... More Info
CO2 Organic Rankine Cycle Experimenter Platform The supercritical CO2 phase change system is both a heat pump and organic rankine cycle which can be used for those purposes and as a supercritical extractor for advanced subcritical and supercritical extraction technology. Uses include producing nanoparticles, precious metal CO2 extraction, lithium battery recycling, and other applications... More Info
| CONTACT TEL: 608-238-6001 Email: greg@infinityturbine.com | RSS | AMP |