PDF Publication Title:
Text from PDF Page: 108
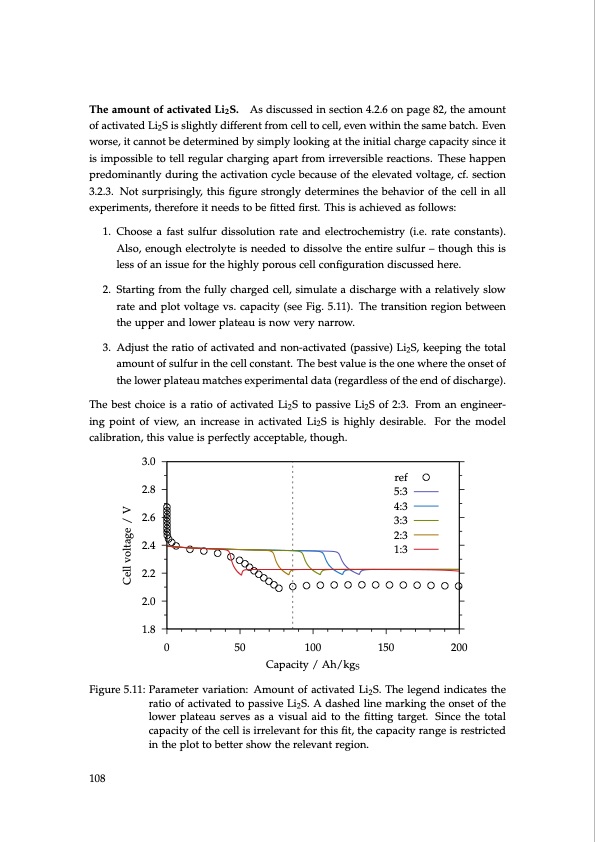
The amount of activated Li2S. As discussed in section 4.2.6 on page 82, the amount of activated Li2S is slightly different from cell to cell, even within the same batch. Even worse, it cannot be determined by simply looking at the initial charge capacity since it is impossible to tell regular charging apart from irreversible reactions. These happen predominantly during the activation cycle because of the elevated voltage, cf. section 3.2.3. Not surprisingly, this figure strongly determines the behavior of the cell in all experiments, therefore it needs to be fitted first. This is achieved as follows: 1. Choose a fast sulfur dissolution rate and electrochemistry (i.e. rate constants). Also, enough electrolyte is needed to dissolve the entire sulfur – though this is less of an issue for the highly porous cell configuration discussed here. 2. Starting from the fully charged cell, simulate a discharge with a relatively slow rate and plot voltage vs. capacity (see Fig. 5.11). The transition region between the upper and lower plateau is now very narrow. 3. Adjust the ratio of activated and non-activated (passive) Li2S, keeping the total amount of sulfur in the cell constant. The best value is the one where the onset of the lower plateau matches experimental data (regardless of the end of discharge). The best choice is a ratio of activated Li2S to passive Li2S of 2:3. From an engineer- ing point of view, an increase in activated Li2S is highly desirable. For the model calibration, this value is perfectly acceptable, though. 3.0 2.8 2.6 2.4 2.2 2.0 1.8 Figure 5.11: Parameter variation: Amount of activated Li2S. The legend indicates the ratio of activated to passive Li2S. A dashed line marking the onset of the lower plateau serves as a visual aid to the fitting target. Since the total capacity of the cell is irrelevant for this fit, the capacity range is restricted in the plot to better show the relevant region. ref 5:3 4:3 3:3 2:3 1:3 Cell voltage / V 108 0 50 100 150 200 Capacity / Ah/kgSPDF Image | Lithium-Sulfur Battery: Design, Characterization, and Physically-based Modeling
PDF Search Title:
Lithium-Sulfur Battery: Design, Characterization, and Physically-based ModelingOriginal File Name Searched:
Dissertation_David_N._Fronczek_The_Lithium_Sulfur_Battery.pdfDIY PDF Search: Google It | Yahoo | Bing
Sulfur Deposition on Carbon Nanofibers using Supercritical CO2 Sulfur Deposition on Carbon Nanofibers using Supercritical CO2. Gamma sulfur also known as mother of pearl sulfur and nacreous sulfur... More Info
CO2 Organic Rankine Cycle Experimenter Platform The supercritical CO2 phase change system is both a heat pump and organic rankine cycle which can be used for those purposes and as a supercritical extractor for advanced subcritical and supercritical extraction technology. Uses include producing nanoparticles, precious metal CO2 extraction, lithium battery recycling, and other applications... More Info
| CONTACT TEL: 608-238-6001 Email: greg@infinityturbine.com | RSS | AMP |