PDF Publication Title:
Text from PDF Page: 008
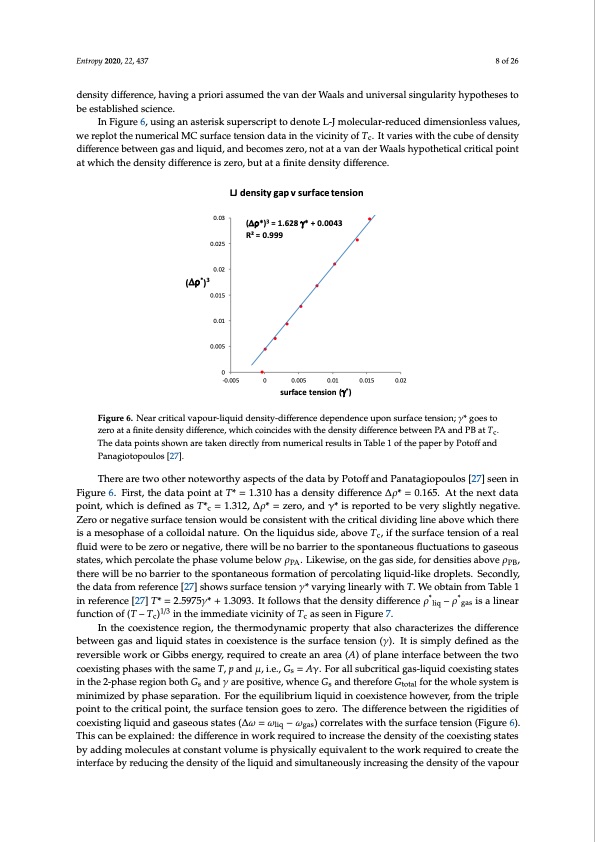
which the surface tension of metastable supersaturated liquid-gas goes to zero, as suggested by He and Attard [26]. At Tc, when the percolation lines PA and PB intersect, there is no barrier to nucleation; hence the surface tension must go to zero at the different coexisting respective densities of gas and liquid. Evidence that this indeed happens can be found in a Monte Carlo computer calculation of the surface Entropy 2020, 22, 437 8 of 26 tension of Lennard–Jones fluids by Potoff and Panagiotopoulos [27]. In the original interpretation of their MC results, these authors overlooked the fact that the surface tension becomes zero at a finite density difference, having a priori assumed the van der Waals and universal singularity hypotheses to density difference, having a priori assumed the van der Waals and universal singularity hypotheses to be established science. be established science. In Figure 6, using an asterisk superscript to denote L-J molecular-reduced dimensionless values, In Figure 6, using an asterisk superscript to denote L-J molecular-reduced dimensionless values, we replot the numerical MC surface tension data in the vicinity of Tc. It varies with the cube of density we replot the numerical MC surface tension data in the vicinity of Tc. It varies with the cube of density difference between gas and liquid, and becomes zero, not at a van der Waals hypothetical critical point difference between gas and liquid, and becomes zero, not at a van der Waals hypothetical critical point at which the density difference is zero, but at a finite density difference. at which the density difference is zero, but at a finite density difference. LJ density gap v surface tension (Δρ*)3 = 1.628 γ* + 0.0043 R2 = 0.999 0.03 0.025 0.02 (Δρ*)3 0.015 0.01 0.005 0 -0.005 0 0.005 0.01 surface tension (γ*) 0.015 0.02 Figure 6. Near critical vapour-liquid density-difference dependence upon surface tension; γ* goes to Figure 6. Near critical vapour-liquid density-difference dependence upon surface tension; γ* goes to zero at a finite density difference, which coincides with the density difference between PA and PB at Tc. zero at a finite density difference, which coincides with the density difference between PA and PB at Tc. The data points shown are taken directly from numerical results in Table 1 of the paper by Potoff and The data points shown are taken directly from numerical results in Table 1 of the paper by Potoff and Panagiotopoulos [27]. Panagiotopoulos [27]. There are two other noteworthy aspects of the data by Potoff and Panatagiopoulos [27] seen in There are two other noteworthy aspects of the data by Potoff and Panatagiopoulos [27] seen in Figure 6. First, the data point at T* = 1.310 has a density difference ∆ρ* = 0.165. At the next data Figure 6. First, the data point at T* = 1.310 has a density difference Δρ* = 0.165. At the next data point, point, which is defined as T*c = 1.312, ∆ρ* = zero, and γ* is reported to be very slightly negative. which is defined as T*c = 1.312, Δρ* = zero, and γ* is reported to be very slightly negative. Zero or Zero or negative surface tension would be consistent with the critical dividing line above which there negative surface tension would be consistent with the critical dividing line above which there is a is a mesophase of a colloidal nature. On the liquidus side, above Tc, if the surface tension of a real mesophase of a colloidal nature. On the liquidus side, above Tc, if the surface tension of a real fluid fluid were to be zero or negative, there will be no barrier to the spontaneous fluctuations to gaseous were to be zero or negative, there will be no barrier to the spontaneous fluctuations to gaseous states, states, which percolate the phase volume below ρPA. Likewise, on the gas side, for densities above ρPB, which percolate the phase volume below ρPA. Likewise, on the gas side, for densities above ρPB, there there will be no barrier to the spontaneous formation of percolating liquid-like droplets. Secondly, will be no barrier to the spontaneous formation of percolating liquid-like droplets. Secondly, the data the data from reference [27] shows surface tension γ* varying linearly with T. We obtain from Table 1 from reference [27] shows surface tension γ* varying linearly with T. We obtain from Table 1 in in reference [27] T* = 2.5975γ* + 1.3093. It follows that the density difference ρ*liq – ρ*gas is a linear reference [27] T* = 2.5975γ* + 1.3093. It follows that the density difference ρ*liq – ρ*gas is a linear function function of (T – Tc)1/3 in the immediate vicinity of Tc as seen in Figure 7. of (T – Tc)1/3 in the immediate vicinity of Tc as seen in Figure 7. In the coexistence region, the thermodynamic property that also characterizes the difference In the coexistence region, the thermodynamic property that also characterizes the difference between gas and liquid states in coexistence is the surface tension (γ). It is simply defined as the between gas and liquid states in coexistence is the surface tension (γ). It is simply defined as the reversible work or Gibbs energy, required to create an area (A) of plane interface between the two reversible work or Gibbs energy, required to create an area (A) of plane interface between the two coexisting phases with the same T, p and μ, i.e., Gs = Aγ. For all subcritical gas-liquid coexisting states in the 2-phase region both Gs and γ are positive, whence Gs and therefore Gtotal for the whole system is minimized by phase separation. For the equilibrium liquid in coexistence however, from the triple point to the critical point, the surface tension goes to zero. The difference between the rigidities of coexisting liquid and gaseous states (∆ω = ωliq − ωgas) correlates with the surface tension (Figure 6). This can be explained: the difference in work required to increase the density of the coexisting states by adding molecules at constant volume is physically equivalent to the work required to create the interface by reducing the density of the liquid and simultaneously increasing the density of the vapourPDF Image | Supercritical Fluid Gaseous and Liquid States
PDF Search Title:
Supercritical Fluid Gaseous and Liquid StatesOriginal File Name Searched:
entropy-22-00437.pdfDIY PDF Search: Google It | Yahoo | Bing
Sulfur Deposition on Carbon Nanofibers using Supercritical CO2 Sulfur Deposition on Carbon Nanofibers using Supercritical CO2. Gamma sulfur also known as mother of pearl sulfur and nacreous sulfur... More Info
CO2 Organic Rankine Cycle Experimenter Platform The supercritical CO2 phase change system is both a heat pump and organic rankine cycle which can be used for those purposes and as a supercritical extractor for advanced subcritical and supercritical extraction technology. Uses include producing nanoparticles, precious metal CO2 extraction, lithium battery recycling, and other applications... More Info
| CONTACT TEL: 608-238-6001 Email: greg@infinityturbine.com | RSS | AMP |