PDF Publication Title:
Text from PDF Page: 009
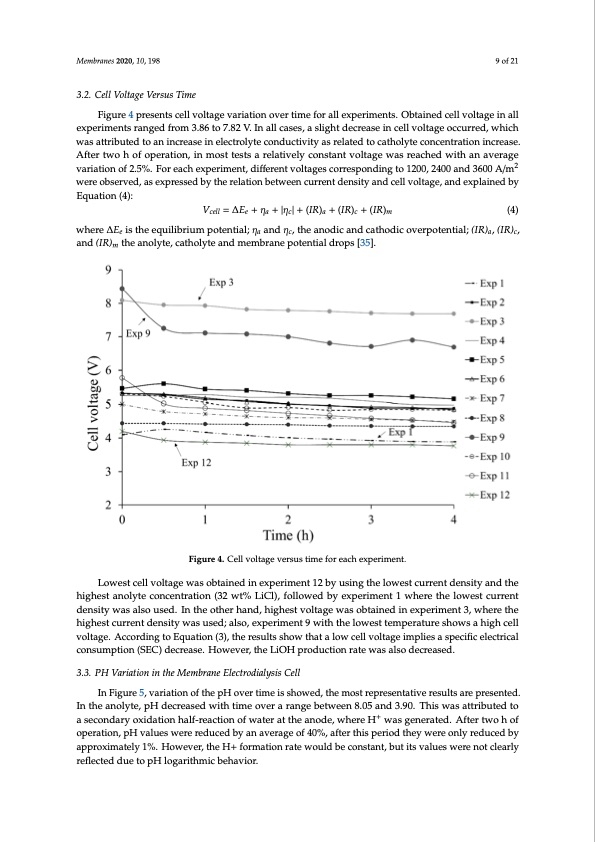
3.2. Cell Voltage Versus Time Figure 4 presents cell voltage variation over time for all experiments. Obtained cell voltage in all experiments ranged from 3.86 to 7.82 V. In all cases, a slight decrease in cell voltage occurred, which Membranes 2020, 10, 198 9 of 21 was attributed to an increase in electrolyte conductivity as related to catholyte concentration increase. After two h of operation, in most tests a relatively constant voltage was reached with an average variation of 2.5%. For each experiment, different voltages corresponding to 1200, 2400 and 3600 A/m2 3.2. Cell Voltage Versus Time were observed, as expressed by the relation between current density and cell voltage, and explained Figure 4 presents cell voltage variation over time for all experiments. Obtained cell voltage in all by equation (4): experiments ranged from 3.86 to 7.82 V. In all cases, a slight decrease in cell voltage occurred, which Vcell =ΔEe + ηa +|ηc|+ (IR)a + (IR)c + (IR)m (4) was attributed to an increase in electrolyte conductivity as related to catholyte concentration increase. AfterWtwheoreh ∆o𝐸f opiserthateioenq,uinlibmriousmt tpesottsenatirael;aηtiavaenlyd cηoc,ntshteanatnvodolitcaagnedwcasthroedacicheodvewrpitohteanntialv;e(rIaRg)ae, (vIaRr)ica,taionndo(IfR2).m5%th.eFaonroelaycthe,ecxaptheorilmytenat,ndiffmeermenbtrvaonletapgoetsecnotirarlesdpronpdsi[n3g5]t.o 1200, 2400 and 3600 A/m2 wereLoobwseersvtecde,lalsveoxltpargeesswedasboybtthaeinreldatiinonexbpeetwriemeennctu1r2rebnytduesninsgitythaendlocweellsvtoclutarrgen,tadndenesxiptylaaineddthbey hEiqguhaetsitonan(4o)l:yte concentration (32 wt% LiCl), followed by experiment 1 where the lowest current density was also used. In theVocetllh=er∆hEaen+d,ηha i+gh|ηecs|t+vo(IlRta)ga e+w(IaRs)co+bt(aIiRn)emd in experiment 3, where t(h4e) highest current density was used; also, experiment 9 with the lowest temperature shows a high cell where ∆Ee is the equilibrium potential; ηa and ηc, the anodic and cathodic overpotential; (IR)a, (IR)c, voltage. According to equation (3), the results show that a low cell voltage implies a specific electrical and (IR)m the anolyte, catholyte and membrane potential drops [35]. consumption (SEC) decrease. However, the LiOH production rate was also decreased. Figure 4. Cell voltage versus time for each experiment. Figure 4. Cell voltage versus time for each experiment. Lowest cell voltage was obtained in experiment 12 by using the lowest current density and the 3.3. PH Variation In the Membrane Electrodialysis Cell highest anolyte concentration (32 wt% LiCl), followed by experiment 1 where the lowest current In Figure 5, variation of the pH over time is showed, the most representative results are density was also used. In the other hand, highest voltage was obtained in experiment 3, where the presented. In the anolyte, pH decreased with time over a range between 8.05 and 3.90. This was highest current density was used; also, experiment 9 with the lowest temperature shows a high cell attributed to a secondary oxidation half-reaction of water at the anode, where H+ was generated. After voltage. According to Equation (3), the results show that a low cell voltage implies a specific electrical consumption (SEC) decrease. However, the LiOH production rate was also decreased. 3.3. PH Variation in the Membrane Electrodialysis Cell In Figure 5, variation of the pH over time is showed, the most representative results are presented. In the anolyte, pH decreased with time over a range between 8.05 and 3.90. This was attributed to a secondary oxidation half-reaction of water at the anode, where H+ was generated. After two h of operation, pH values were reduced by an average of 40%, after this period they were only reduced by approximately 1%. However, the H+ formation rate would be constant, but its values were not clearly reflected due to pH logarithmic behavior.PDF Image | Battery Grade Li Hydroxide by Membrane Electrodialysis
PDF Search Title:
Battery Grade Li Hydroxide by Membrane ElectrodialysisOriginal File Name Searched:
membranes-10-00198.pdfDIY PDF Search: Google It | Yahoo | Bing
Product and Development Focus for Infinity Turbine
ORC Waste Heat Turbine and ORC System Build Plans: All turbine plans are $10,000 each. This allows you to build a system and then consider licensing for production after you have completed and tested a unit.Redox Flow Battery Technology: With the advent of the new USA tax credits for producing and selling batteries ($35/kW) we are focussing on a simple flow battery using shipping containers as the modular electrolyte storage units with tax credits up to $140,000 per system. Our main focus is on the salt battery. This battery can be used for both thermal and electrical storage applications. We call it the Cogeneration Battery or Cogen Battery. One project is converting salt (brine) based water conditioners to simultaneously produce power. In addition, there are many opportunities to extract Lithium from brine (salt lakes, groundwater, and producer water).Salt water or brine are huge sources for lithium. Most of the worlds lithium is acquired from a brine source. It's even in seawater in a low concentration. Brine is also a byproduct of huge powerplants, which can now use that as an electrolyte and a huge flow battery (which allows storage at the source).We welcome any business and equipment inquiries, as well as licensing our turbines for manufacturing.| CONTACT TEL: 608-238-6001 Email: greg@infinityturbine.com | RSS | AMP |