PDF Publication Title:
Text from PDF Page: 012
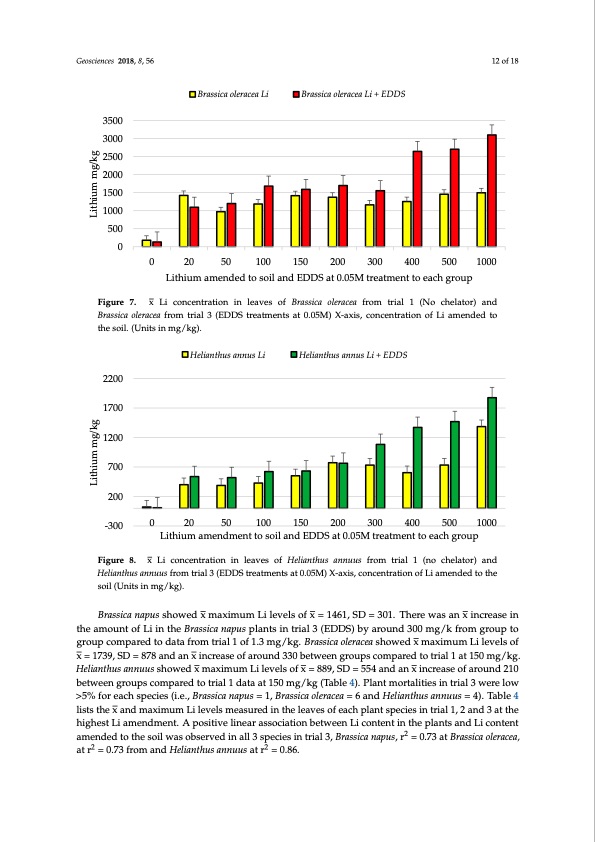
Lithium amended to soil and EDDS at 0.05M treatment to each group Figure 6. x̅ Li concentration in leaves of Brassica napus from trial 1 (No chelator) and Brassica napus from trial 3 (EDDS treatments at 0.05M) X-axis, concentration of Li amended to the soil. (Units in Geosciences 2018, 8, 56 12 of 18 mg/kg). 3500 3000 2500 2000 1500 1000 500 Brassica oleracea Li Brassica oleracea Li + EDDS 0 0 20 50 100 150 200 300 400 500 1000 Lithium amended to soil and EDDS at 0.05M treatment to each group Figure 7. x Li concentration in leaves of Brassica oleracea from trial 1 (No chelator) and Figure 7. x̅ Li concentration in leaves of Brassica oleracea from trial 1 (No chelator) and Brassica oleracea Brassica oleracea from trial 3 (EDDS treatments at 0.05M) X-axis, concentration of Li amended to from trial 3 (EDDS treatments at 0.05M) X-axis, concentration of Li amended to the soil. (Units in Geosciences 2018, 8, x FOR PEER REVIEW 13 of 19 the soil. (Units in mg/kg). mg/kg). 2200 1700 1200 700 200 -300 0 20 50 100 150 200 300 400 500 1000 Lithium amendment to soil and EDDS at 0.05M treatment to each group Helianthus annus Li Helianthus annus Li + EDDS Figure 8. x Li concentration in leaves of Helianthus annuus from trial 1 (no chelator) and Figure 8. x̅ Li concentration in leaves of Helianthus annuus from trial 1 (no chelator) and Helianthus Helianthus annuus from trial 3 (EDDS treatments at 0.05M) X-axis, concentration of Li amended to the annuus from trial 3 (EDDS treatments at 0.05M) X-axis, concentration of Li amended to the soil (Units soil (Units in mg/kg). in mg/kg). Brassica napus showed x maximum Li levels of x = 1461, SD = 301. There was an x increase in Brassica napus showed x̅ maximum Li levels of x̄ = 1461, SD = 301. There was an x̅ increase in the the amount of Li in the Brassica napus plants in trial 3 (EDDS) by around 300 mg/k from group to amount of Li in the Brassica napus plants in trial 3 (EDDS) by around 300 mg/k from group to group group compared to data from trial 1 of 1.3 mg/kg. Brassica oleracea showed x maximum Li levels of compared to data from trial 1 of 1.3 mg/kg. Brassica oleracea showed x̅ maximum Li levels of x̄ = 1739, x = 1739, SD = 878 and an x increase of around 330 between groups compared to trial 1 at 150 mg/kg. SD = 878 and an x̅ increase of around 330 between groups compared to trial 1 at 150 mg/kg. Helianthus Helianthus annuus showed x maximum Li levels of x = 889, SD = 554 and an x increase of around 210 annuus showed x̅ maximum Li levels of x̄ = 889, SD = 554 and an x̅ increase of around 210 between between groups compared to trial 1 data at 150 mg/kg (Table 4). Plant mortalities in trial 3 were low groups compared to trial 1 data at 150 mg/kg (Table 4). Plant mortalities in trial 3 were low >5% for >5% for each species (i.e., Brassica napus = 1, Brassica oleracea = 6 and Helianthus annuus = 4). Table 4 each species (i.e., Brassica napus = 1, Brassica oleracea = 6 and Helianthus annuus = 4). Table 4 lists the x̅ lists the x and maximum Li levels measured in the leaves of each plant species in trial 1, 2 and 3 at the and maximum Li levels measured in the leaves of each plant species in trial 1, 2 and 3 at the highest highest Li amendment. A positive linear association between Li content in the plants and Li content Li amendment. A positive linear association between Li content in the plants and Li content amended amended to the soil was observed in all 3 species in trial 3, Brassica napus, r2 = 0.73 at Brassica oleracea, to the soil was observed in all 3 species in trial 3, Brassica napus, r2 = 0.73 at Brassica oleracea, at r2 = 0.73 at r2 = 0.73 from and Helianthus annuus at r2 = 0.86. from and Helianthus annuus at r2 = 0.86. Table 4. x̅ maximum Li levels, standard deviations and maximum levels of Li in plants from all 3 trials (units in mg/kg). Plant Species, Trial Number Trial 1, Brassica napus and Li Trial 2, Brassica napus Li and EDTA x̅ Li Concentration 11.3 1849 Standard Deviation 3.9 914 Max Li 17.5 3577 Lithium mg/kg Lithium mg/kgPDF Image | Induced Plant Accumulation of Lithium
PDF Search Title:
Induced Plant Accumulation of LithiumOriginal File Name Searched:
geosciences-08-00056.pdfDIY PDF Search: Google It | Yahoo | Bing
Product and Development Focus for Infinity Turbine
ORC Waste Heat Turbine and ORC System Build Plans: All turbine plans are $10,000 each. This allows you to build a system and then consider licensing for production after you have completed and tested a unit.Redox Flow Battery Technology: With the advent of the new USA tax credits for producing and selling batteries ($35/kW) we are focussing on a simple flow battery using shipping containers as the modular electrolyte storage units with tax credits up to $140,000 per system. Our main focus is on the salt battery. This battery can be used for both thermal and electrical storage applications. We call it the Cogeneration Battery or Cogen Battery. One project is converting salt (brine) based water conditioners to simultaneously produce power. In addition, there are many opportunities to extract Lithium from brine (salt lakes, groundwater, and producer water).Salt water or brine are huge sources for lithium. Most of the worlds lithium is acquired from a brine source. It's even in seawater in a low concentration. Brine is also a byproduct of huge powerplants, which can now use that as an electrolyte and a huge flow battery (which allows storage at the source).We welcome any business and equipment inquiries, as well as licensing our turbines for manufacturing.| CONTACT TEL: 608-238-6001 Email: greg@infinityturbine.com | RSS | AMP |