PDF Publication Title:
Text from PDF Page: 008
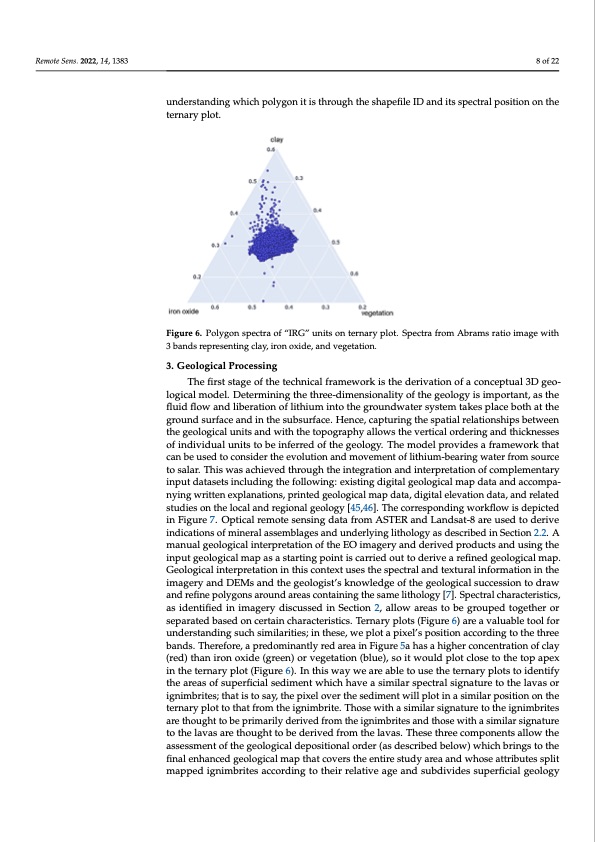
Remote Sens. 2022, 14, x FOR PEER REVIEW 8 of 21 Remote Sens. 2022, 14, 1383 8 of 22 Figure 5. Spectral index maps developed over the study area. (a) SWIR Abrams ratio. RGB image cuhnadnneerslstaanrdeicnlagyw(Rh)i,chiropnoloyxgidoen(iGti)s,athnrdovuegghetahteiosnh(aBp)e.fi(ble)TIDIRaindeixtscsopmecbtirnaltipoons.iRtiGonBoimnatghe channels are Quartz Index (QI) (R), Carbonate Index (CI) (G), and Mafic Index corrected (MIcor) (B). ternary plot. Figure 6. Polygon spectra of “IRG” units on ternary plot. Spectra from Abrams ratio image with 3 bands representing clay, iron oxide, and vegetation. Figure 6. Polygon spectra of “IRG” units on ternary plot. Spectra from Abrams ratio image with 3 bands representing clay, iron oxide, and vegetation. 3. Geological Processing The first stage of the technical framework is the derivation of a conceptual 3D geo- 3. Geological Processing logical model. Determining the three-dimensionality of the geology is important, as the The first stage of the technical framework is the derivation of a conceptual 3D geo- fluid flow and liberation of lithium into the groundwater system takes place both at the logical model. Determining the three-dimensionality of the geology is important, as the ground surface and in the subsurface. Hence, capturing the spatial relationships between fluid flow and liberation of lithium into the groundwater system takes place both at the the geological units and with the topography allows the vertical ordering and thicknesses ground surface and in the subsurface. Hence, capturing the spatial relationships between of individual units to be inferred of the geology. The model provides a framework that the geological units and with the topography allows the vertical ordering and thicknesses can be used to consider the evolution and movement of lithium-bearing water from source of individual units to be inferred of the geology. The model provides a framework that to salar. This was achieved through the integration and interpretation of complementary can be used to consider the evolution and movement of lithium-bearing water from source input datasets including the following: existing digital geological map data and accompa- to salar. This was achieved through the integration and interpretation of complementary nying written explanations, printed geological map data, digital elevation data, and related input datasets including the following: existing digital geological map data and accompa- studies on the local and regional geology [45,46]. The corresponding workflow is depicted nying written explanations, printed geological map data, digital elevation data, and re- in Figure 7. Optical remote sensing data from ASTER and Landsat-8 are used to derive lated studies on the local and regional geology [45,46]. The corresponding workflow is indications of mineral assemblages and underlying lithology as described in Section 2.2. A depicted in Figure 7. Optical remote sensing data from ASTER and Landsat-8 are used to manual geological interpretation of the EO imagery and derived products and using the derive indications of mineral assemblages and underlying lithology as described in Sec- input geological map as a starting point is carried out to derive a refined geological map. tion 2.2. A manual geological interpretation of the EO imagery and derived products and Geological interpretation in this context uses the spectral and textural information in the using the input geological map as a starting point is carried out to derive a refined geo- imagery and DEMs and the geologist’s knowledge of the geological succession to draw logical map. Geological interpretation in this context uses the spectral and textural infor- and refine polygons around areas containing the same lithology [7]. Spectral characteristics, mation in the imagery and DEMs and the geologist’s knowledge of the geological succes- as identified in imagery discussed in Section 2, allow areas to be grouped together or sion to draw and refine polygons around areas containing the same lithology [7]. Spectral separated based on certain characteristics. Ternary plots (Figure 6) are a valuable tool for characteristics, as identified in imagery discussed in Section 2, allow areas to be grouped understanding such similarities; in these, we plot a pixel’s position according to the three together or separated based on certain characteristics. Ternary plots (Figure 6) are a valu- bands. Therefore, a predominantly red area in Figure 5a has a higher concentration of clay able tool for understanding such similarities; in these, we plot a pixel’s position according (red) than iron oxide (green) or vegetation (blue), so it would plot close to the top apex to the three bands. Therefore, a predominantly red area in Figure 5a has a higher concen- in the ternary plot (Figure 6). In this way we are able to use the ternary plots to identify tration of clay (red) than iron oxide (green) or vegetation (blue), so it would plot close to the areas of superficial sediment which have a similar spectral signature to the lavas or tihgenitmopbraiptesx;itnhatthiestteornsayry,tphleopti(xFeigluovrer6)th.Ienstehdiismweanytwiellapreloatbinleatosiumsielatrhepotesritnioarnyopnlothtse ttoerindaernytipfylotthteoatrheatsforofmsuptheerfigcniailmsbedritme.eTnhtowsheiwchithaavesiamsiilmarislaigrnsapteucrteratlostihgneaigtunriemtbortihtes larveatshoruigghntitmobreitpersi;mthaartilyisdtoersivaeyd, tfhreompixtheel oigvneirmthbreitsesdaimndenthtowseillwpitlhotainsima siliamr isliagrnpaotusri-e ttionthoenlathveastearrneatrhyopulgohttotothbaetdfreorimvetdhefriogmnimthberliatev.aTs.hToshesweithraeesicmomilaprosnigenatstuarlelotwo tthe iagsnsiemssbmrietenst aorfeththeoguegohlotgtiocabledeppriomsiatrioilnyadl oeridverd(afrsodmestchriebeigdnbimelborwit)eswahnicdhtbhroinsegswtioththae sfiimnailaernshiagncaetudrgeetolothgiecalalvmasapartehatht ocouvgehrtsttohbeendteireivsetdudfryoamretahaenladvwash.oTsheeastetrtihbruetescospmli-t pmoanpenptesdailglonwimtbhreitaessaescscmorednintgoftothtehegierorleolgaitciavledaegpeoasintdionsualbdorivdiedre(sasudpeesrcfiricbiaedlgbeeollowgy)PDF Image | Lithium Brine Deposit Formation
PDF Search Title:
Lithium Brine Deposit FormationOriginal File Name Searched:
remotesensing-14-01383-v2.pdfDIY PDF Search: Google It | Yahoo | Bing
Product and Development Focus for Infinity Turbine
ORC Waste Heat Turbine and ORC System Build Plans: All turbine plans are $10,000 each. This allows you to build a system and then consider licensing for production after you have completed and tested a unit.Redox Flow Battery Technology: With the advent of the new USA tax credits for producing and selling batteries ($35/kW) we are focussing on a simple flow battery using shipping containers as the modular electrolyte storage units with tax credits up to $140,000 per system. Our main focus is on the salt battery. This battery can be used for both thermal and electrical storage applications. We call it the Cogeneration Battery or Cogen Battery. One project is converting salt (brine) based water conditioners to simultaneously produce power. In addition, there are many opportunities to extract Lithium from brine (salt lakes, groundwater, and producer water).Salt water or brine are huge sources for lithium. Most of the worlds lithium is acquired from a brine source. It's even in seawater in a low concentration. Brine is also a byproduct of huge powerplants, which can now use that as an electrolyte and a huge flow battery (which allows storage at the source).We welcome any business and equipment inquiries, as well as licensing our turbines for manufacturing.| CONTACT TEL: 608-238-6001 Email: greg@infinityturbine.com | RSS | AMP |