PDF Publication Title:
Text from PDF Page: 009
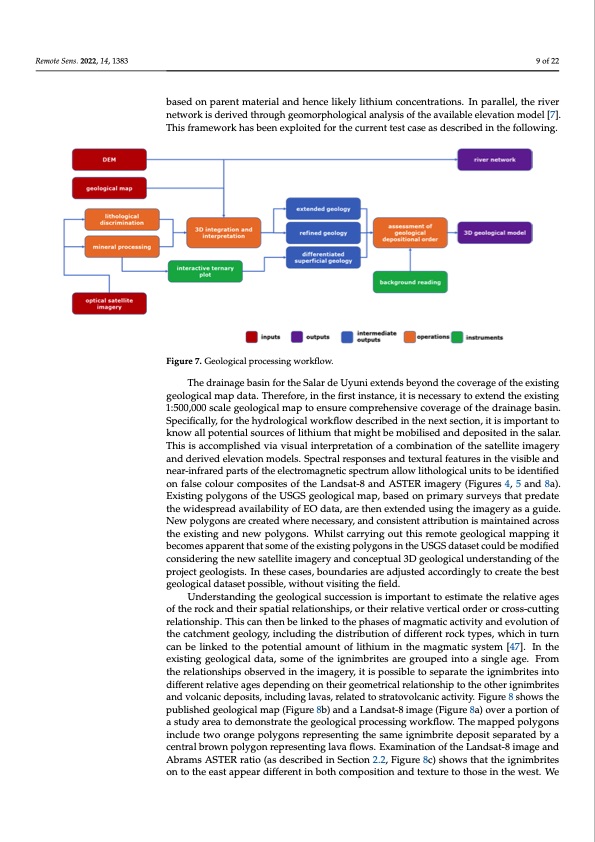
Remote Sens. 2022, 14, x FOR PEER REVIEW 9 of 21 Remote Sens. 2022, 14, 1383 9 of 22 which brings to the final enhanced geological map that covers the entire study area and whose attributes split mapped ignimbrites according to their relative age and subdivides superficial geology based on parent material and hence likely lithium concentrations. In based on parent material and hence likely lithium concentrations. In parallel, the river parallel, the river network is derived through geomorphological analysis of the available network is derived through geomorphological analysis of the available elevation model [7]. elevation model [7]. This framework has been exploited for the current test case as de- This framework has been exploited for the current test case as described in the following. scribed in the following. Figure 7. Geological processing workflow. Figure 7. Geological processing workflow. ThedraiinagebassiinffoorrththeeSSaalalarrddeeUUyyuunni eixetxetnednsdbsebyeoynodndthtehceocvoevraegraegoefothfetheexiesxtinstg- ginegolgoegoilcoagl imcaalpmdaaptad.aTtah.eTrehfeorref,oirne,thinetfihrestfiirnststiannstcaen, citei,sitniescneescseasrsyatroyetoxtexntdenthdetheexiesxtinstg- 1in:5g001,:5000,0sc0a0lescgaeleolgoegoilcoaglimcaalpmtaopetnoseunresucroemcpomrephreenhseivnesicvoevceorvaegreagoef tohfethderadirnaigneagbeasbian-. Specifically, for the hydrological workflow described in the next section, it is important to sin. Specifically, for the hydrological workflow described in the next section, it is im- know all potential sources of lithium that might be mobilised and deposited in the salar. portant to know all potential sources of lithium that might be mobilised and deposited in This is accomplished via visual interpretation of a combination of the satellite imagery the salar. This is accomplished via visual interpretation of a combination of the satellite and derived elevation models. Spectral responses and textural features in the visible and imagery and derived elevation models. Spectral responses and textural features in the vis- near-infrared parts of the electromagnetic spectrum allow lithological units to be identified ible and near-infrared parts of the electromagnetic spectrum allow lithological units to be on false colour composites of the Landsat-8 and ASTER imagery (Figures 4, 5 and 8a). identified on false colour composites of the Landsat-8 and ASTER imagery (Figures 4, 5, Existing polygons of the USGS geological map, based on primary surveys that predate and 8a). Existing polygons of the USGS geological map, based on primary surveys that the widespread availability of EO data, are then extended using the imagery as a guide. predate the widespread availability of EO data, are then extended using the imagery as a New polygons are created where necessary, and consistent attribution is maintained across guide. New polygons are created where necessary, and consistent attribution is main- the existing and new polygons. Whilst carrying out this remote geological mapping it tained across the existing and new polygons. Whilst carrying out this remote geological becomes apparent that some of the existing polygons in the USGS dataset could be modified mapping it becomes apparent that some of the existing polygons in the USGS dataset considering the new satellite imagery and conceptual 3D geological understanding of the could be modified considering the new satellite imagery and conceptual 3D geological project geologists. In these cases, boundaries are adjusted accordingly to create the best understanding of the project geologists. In these cases, boundaries are adjusted accord- geological dataset possible, without visiting the field. ingly to create the best geological dataset possible, without visiting the field. Understanding the geological succession is important to estimate the relative ages Understanding the geological succession is important to estimate the relative ages of of the rock and their spatial relationships, or their relative vertical order or cross-cutting the rock and their spatial relationships, or their relative vertical order or cross-cutting re- relationship. This can then be linked to the phases of magmatic activity and evolution of lationship. This can then be linked to the phases of magmatic activity and evolution of the the catchment geology, including the distribution of different rock types, which in turn catchment geology, including the distribution of different rock types, which in turn can can be linked to the potential amount of lithium in the magmatic system [47]. In the be linked to the potential amount of lithium in the magmatic system [47]. In the existing existing geological data, some of the ignimbrites are grouped into a single age. From geological data, some of the ignimbrites are grouped into a single age. From the relation- the relationships observed in the imagery, it is possible to separate the ignimbrites into ships observed in the imagery, it is possible to separate the ignimbrites into different rel- different relative ages depending on their geometrical relationship to the other ignimbrites ative ages depending on their geometrical relationship to the other ignimbrites and vol- and volcanic deposits, including lavas, related to stratovolcanic activity. Figure 8 shows the canic deposits, including lavas, related to stratovolcanic activity. Figure 8 shows the pub- published geological map (Figure 8b) and a Landsat-8 image (Figure 8a) over a portion of lished geological map (Figure 8b) and a Landsat-8 image (Figure 8a) over a portion of a a study area to demonstrate the geological processing workflow. The mapped polygons study area to demonstrate the geological processing workflow. The mapped polygons in- include two orange polygons representing the same ignimbrite deposit separated by a central brown polygon representing lava flows. Examination of the Landsat-8 image and Abrams ASTER ratio (as described in Section 2.2, Figure 8c) shows that the ignimbrites on to the east appear different in both composition and texture to those in the west. WePDF Image | Lithium Brine Deposit Formation
PDF Search Title:
Lithium Brine Deposit FormationOriginal File Name Searched:
remotesensing-14-01383-v2.pdfDIY PDF Search: Google It | Yahoo | Bing
Product and Development Focus for Infinity Turbine
ORC Waste Heat Turbine and ORC System Build Plans: All turbine plans are $10,000 each. This allows you to build a system and then consider licensing for production after you have completed and tested a unit.Redox Flow Battery Technology: With the advent of the new USA tax credits for producing and selling batteries ($35/kW) we are focussing on a simple flow battery using shipping containers as the modular electrolyte storage units with tax credits up to $140,000 per system. Our main focus is on the salt battery. This battery can be used for both thermal and electrical storage applications. We call it the Cogeneration Battery or Cogen Battery. One project is converting salt (brine) based water conditioners to simultaneously produce power. In addition, there are many opportunities to extract Lithium from brine (salt lakes, groundwater, and producer water).Salt water or brine are huge sources for lithium. Most of the worlds lithium is acquired from a brine source. It's even in seawater in a low concentration. Brine is also a byproduct of huge powerplants, which can now use that as an electrolyte and a huge flow battery (which allows storage at the source).We welcome any business and equipment inquiries, as well as licensing our turbines for manufacturing.| CONTACT TEL: 608-238-6001 Email: greg@infinityturbine.com | RSS | AMP |