PDF Publication Title:
Text from PDF Page: 006
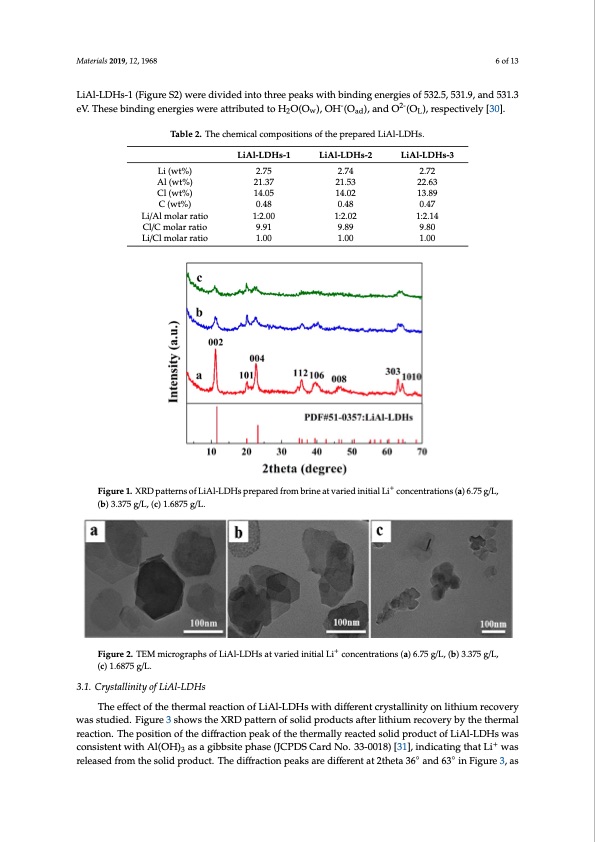
Materials 2019, 12, 1968 6 of 13 LMiAatle-rLiaDls 2H01s9-1, 1(2F, xigFuOrRePSE2E)RwReErVeIEdWivided into three peaks with binding energies of 532.5, 531.9, and6 o5f313.3 Materials 2019, 12, x FOR PEER REVIEW - 2- 6 of 13 eV. These binding energies were attributed to H2O(Ow), OH (Oad), and O (OL), respectively [30]. Table 2. The chemical compositions of the prepared LiAl-LDHs. Table 2. The chemical compositions of the prepared LiAl-LDHs. Table 2. The chemical compositions of the prepared LiAl-LDHs. Li/Cl molar ratio 9.91 9.89 9.80 Li/Cl molar ratio Li/Cl molar ratio 1.00 1.00 1.00 LiAl-LDHs-1 LiAl-LDHs-2 LiAl-LDHs-3 Li (wt%) LiAl-LDHs-1 LiAl-LDHs-2 LiAl-LDHs-3 Li (wt%) LiAl-LDHs-1 LiAl-LDHs-2 LiAl-LDHs-3 Al (wt%) 2.75 2.74 2.72 Li (wt%) 21.37 21.53 22.63 2.75 2.74 2.72 Al (wt%) 2.75 2.74 2.72 Cl (wt%) 21.37 21.53 22.63 Al (wt%) 14.05 14.02 13.89 Cl (wt%) 21.37 21.53 22.63 Cl (wtt%)) 14.05 14.02 13.89 C (wt%) 01.4.805 01.4.802 0.1437.89 C (wt%) 0.48 0.48 0.47 Li/Al molar ratio 0.48 0.48 0.47 Li/ALli/mAollamr oralatiroratio Cl/C molar ratio 1:21.0:02.00 1:2.10:2.02 9.91 9.89 1:21.1:24.14 9.80 Cl/C molar ratio Cl/C molar ratio 9.91 9.89 9.80 1:2.00 1:2.02 1:2.14 1.00 1.00 1.00 1.00 1.00 1.00 Figure 1. XRD patterns of LiAl-LDHs prepared from brine at varied initial Li+ concentrations (a) 6.75 Figure 1. XRD patterns of LiAl-LDHs prepared from brine at varied initial Li+ concentrations (a) 6.75 g/L, g/L, (b) 3.375 g/L, (c) 1.6875 g/L. + Figure 1. XRD patterns of LiAl-LDHs prepared from brine at varied initial Li concentrations (a) 6.75 (b) 3.375 g/L, (c) 1.6875 g/L. g/L, (b) 3.375 g/L, (c) 1.6875 g/L. ++ FFiigguurree22..TTEEMmicircoroggrarapphhssofofLiLAiAl-Ll-DLDHHs satavtavraierdiedinitniaitliaLliLicocnocnecnetnratrtaiotinosn(sa)(a6).765.7g5/Lg,/L(b,)(b3.)3735.3g75/L, Figure 2. TEM micrographs of LiAl-LDHs at varied initial Li+ concentrations (a) 6.75 g/L, (b) 3.375 g/L, (c) 1.6875 g/L. 3.1. Crystallinity of LiAl-LDHs 3.1. Crystallinity of LiAl-LDHs The effect of the thermal reaction of LiAl-LDHs with different crystallinity on lithium recovery The effect of the thermal reaction of LiAl-LDHs with different crystallinity on lithium recovery g/L, (c) 1.6875 g/L. (c) 1.6875 g/L. 3.1. Crystallinity of LiAl-LDHs was studied. Figure 3 shows the XRD pattern of solid products after lithium recovery by the thermal was studied. Figure 3 shows the XRD pattern of solid products after lithium recovery by the thermal The effect of the thermal reaction of LiAl-LDHs with different crystallinity on lithium recovery reaction. The position of the diffraction peak of the thermally reacted solid product of LiAl-LDHs was reaction. The position of the diffraction peak of the thermally reacted solid product of LiAl-LDHs was studied. Figure 3 shows the XRD pattern of solid products after lithium recovery by the+ thermal + cwonasisctoenstiswteinthtwAilt(hOHAl)(OaHs)a3gaisbabsgitibebpshitaespeh(JaCsePD(JCSPCDaSrdCNarod.3N3o-0.03138-0)0[1381)],[i3n1d],icinadtiincgattihnagttLhiatwLias 3 reaction. The position of the diffraction peak of the thermally reacted so◦lid prod◦uct of LiAl-LDHs rweleaassreedlefarosemdtfhreomsoltihdepsrodliudcpt.rTodheucdti.ffTrahcetidoinffpraecatkiosnarpeedaikffseraernetdatif2fethrentat 3a6t 2athnedta6336i°naFnidgu6r3e°3i,nas was consistent with Al(OH)3 as a gibbsite phase (JCPDS Card No. 33-0018) [31], indicating that Li+ Figure 3, as such they cannot be used as evidence for identifying substances because they are weaker was released from the solid product. The diffraction peaks are different at 2theta 36° and 63° in diffraction signals. In order to further discuss the relationship between lithium recovery and Figure 3, as such they cannot be used as evidence for identifying substances because they are weaker diffraction signals. In order to further discuss the relationship between lithium recovery andPDF Image | Lithium Recovery Pre-Synthesized Chlorine-Ion-Intercalated
PDF Search Title:
Lithium Recovery Pre-Synthesized Chlorine-Ion-IntercalatedOriginal File Name Searched:
materials-12-01968.pdfDIY PDF Search: Google It | Yahoo | Bing
Product and Development Focus for Infinity Turbine
ORC Waste Heat Turbine and ORC System Build Plans: All turbine plans are $10,000 each. This allows you to build a system and then consider licensing for production after you have completed and tested a unit.Redox Flow Battery Technology: With the advent of the new USA tax credits for producing and selling batteries ($35/kW) we are focussing on a simple flow battery using shipping containers as the modular electrolyte storage units with tax credits up to $140,000 per system. Our main focus is on the salt battery. This battery can be used for both thermal and electrical storage applications. We call it the Cogeneration Battery or Cogen Battery. One project is converting salt (brine) based water conditioners to simultaneously produce power. In addition, there are many opportunities to extract Lithium from brine (salt lakes, groundwater, and producer water).Salt water or brine are huge sources for lithium. Most of the worlds lithium is acquired from a brine source. It's even in seawater in a low concentration. Brine is also a byproduct of huge powerplants, which can now use that as an electrolyte and a huge flow battery (which allows storage at the source).We welcome any business and equipment inquiries, as well as licensing our turbines for manufacturing.| CONTACT TEL: 608-238-6001 Email: greg@infinityturbine.com | RSS | AMP |