PDF Publication Title:
Text from PDF Page: 006
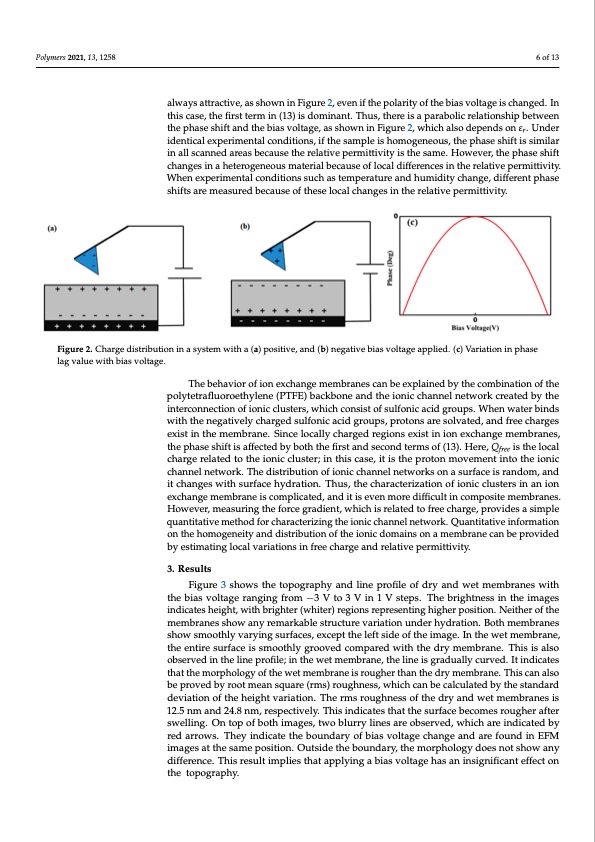
Polymers 2021, 13, x 6 of 14 Polymers 2021, 13, 1258 6 of 13 lag value with bias voltage. positive bias voltage is applied, the tip charge is negative, and the sample surface is positively charged, and vice versa. Thus, the force between the tip and the sample surface is always attractive, as shown in Figure 2, even if the polarity of the bias voltage is changed. In this case, the first term in (13) is dominant. Thus, there is a parabolic always attractive, as shown in Figure 2, even if the polarity of the bias voltage is changed. In relationship between the phase shift and the bias voltage, as shown in Figure 2, which also this case, the first term in (13) is dominant. Thus, there is a parabolic relationship between depends on εr. Under identical experimental conditions, if the sample is homogeneous, the phase shift and the bias voltage, as shown in Figure 2, which also depends on εr. Under the phase shift is similar in all scanned areas because the relative permittivity is the same. identical experimental conditions, if the sample is homogeneous, the phase shift is similar However, the phase shift changes in a heterogeneous material because of local differences in all scanned areas because the relative permittivity is the same. However, the phase shift in the relative permittivity. When experimental conditions such as temperature and changes in a heterogeneous material because of local differences in the relative permittivity. humidity change, different phase shifts are measured because of these local changes in When experimental conditions such as temperature and humidity change, different phase the relative permittivity. shifts are measured because of these local changes in the relative permittivity. Figure 2. Charge distribution in a system with a (a) positive, and (b) negative bias voltage applied. (c) Variation in phase Figure 2. Charge distribution in a system with a (a) positive, and (b) negative bias voltage applied. (c) Variation in phase lag value with bias voltage. The behavior of ion exchange membranes can be explained by the combination of the The behavior of ion exchange membranes can be explained by the combination of the polytetrafluoroethylene (PTFE) backbone and the ionic channel network created by the polytetrafluoroethylene (PTFE) backbone and the ionic channel network created by the interconnection of ionic clusters, which consist of sulfonic acid groups. When water binds interconnection of ionic clusters, which consist of sulfonic acid groups. When water binds with the negatively charged sulfonic acid groups, protons are solvated, and free charges with the negatively charged sulfonic acid groups, protons are solvated, and free charges exeixstisitninthtehemmemembrbarnaen.eS.inSicnecleolcoacllayllychcahragregdedrergeigoinosnesxeisxtisitninioinonexecxhcahnagnegemmemembrbarnaense,s, thtehpehpahsaessehsihftifitsiasfafeffcetcetdedbybybobtohththtehefifirsrtstananddsesceoconnddtetremrmssooff(1(133).).HHereere,,QQfree isitshtehelolcoaclal free chcahragregererlealtaetdedtotothteheioinoinciclculsutsetre;ri;ninthtihsiscacsaes,ei,tiitsisthteheprportotnonmmovoevmemenetnitnitnotothteheioinoincic chcahnanenlenlentewtworokr.kT.hTehdeidstirsitbriubtuiotinonofoifoinoincichcahnanenlenlentewtworokrskosnona asusrufrafcaeceisirsarnadnodmom, a,nadnd iticthcahnagnegsewswithithsusrufrafcaecehyhdyrdartaiotino.nT.hTuhsu,st,htehcehcahrarcatecrteizraiztiaotnionofoifoinoincicluclsutestresrisninananioinon execxhcahnagnegemeembrrane iisscocmomplpiclaictaedte,da,ndanitdis ietveins mevoerendimffiocruelt dinifcfiocmulptosinite cmoempborsaintes. mHemowbreavneers,.mHeaoswuervinegr,thmeefaosruceringrgadthientf,owrcheicghraisdirenlat,tewdhtoicfhreiescrhealragted, ptrovfirdeescahsairmgep,le prqouvaindteistataivseimpetlehoqdufaonrtcithaatrivacetemrizetinhgodthefoironcihcacrhaacntenreilzninegtwtohrek.ioQnuicancthitantinvelinfeotrwmoartkio.n Qounanthtietahtiovme oingfeonremitaytaionndodnisthriebuhtoimonoogfentheeitiyonaincdddoimstarinbsutoinona omfetmhebrioanieccdaonmbeaipnrsoovnidaed by estimating local variations in free charge and relative permittivity. membrane can be provided by estimating local variations in free charge and relative permittivity. 3. Results 3. ResuFlitgsure 3 shows the topography and line profile of dry and wet membranes with the bias voltage ranging from −3 V to 3 V in 1 V steps. The brightness in the images Figure 3 shows the topography and line profile of dry and wet membranes with the indicates height, with brighter (whiter) regions representing higher position. Neither of the bias voltage ranging from –3 V to 3 V in 1 V steps. The brightness in the images indicates membranes show any remarkable structure variation under hydration. Both membranes height, with brighter (whiter) regions representing higher position. Neither of the show smoothly varying surfaces, except the left side of the image. In the wet membrane, membranes show any remarkable structure variation under hydration. Both membranes the entire surface is smoothly grooved compared with the dry membrane. This is also show smoothly varying surfaces, except the left side of the image. In the wet membrane, observed in the line profile; in the wet membrane, the line is gradually curved. It indicates the entire surface is smoothly grooved compared with the dry membrane. This is also that the morphology of the wet membrane is rougher than the dry membrane. This can also observed in the line profile; in the wet membrane, the line is gradually curved. It indicates be proved by root mean square (rms) roughness, which can be calculated by the standard that the morphology of the wet membrane is rougher than the dry membrane. This can deviation of the height variation. The rms roughness of the dry and wet membranes is also be proved by root mean square (rms) roughness, which can be calculated by the 12.5 nm and 24.8 nm, respectively. This indicates that the surface becomes rougher after standard deviation of the height variation. The rms roughness of the dry and wet swelling. On top of both images, two blurry lines are observed, which are indicated by membranes is 12.5 nm and 24.8 nm, respectively. This indicates that the surface becomes red arrows. They indicate the boundary of bias voltage change and are found in EFM rougher after swelling. On top of both images, two blurry lines are observed, which are images at the same position. Outside the boundary, the morphology does not show any difference. This result implies that applying a bias voltage has an insignificant effect on the topography.PDF Image | Ionic Domains on a Proton Exchange Membrane Electrostatics
PDF Search Title:
Ionic Domains on a Proton Exchange Membrane ElectrostaticsOriginal File Name Searched:
polymers-13-01258-v2.pdfDIY PDF Search: Google It | Yahoo | Bing
NFT (Non Fungible Token): Buy our tech, design, development or system NFT and become part of our tech NFT network... More Info
IT XR Project Redstone NFT Available for Sale: NFT for high tech turbine design with one part 3D printed counter-rotating energy turbine. Be part of the future with this NFT. Can be bought and sold but only one design NFT exists. Royalties go to the developer (Infinity) to keep enhancing design and applications... More Info
Infinity Turbine IT XR Project Redstone Design: NFT for sale... NFT for high tech turbine design with one part 3D printed counter-rotating energy turbine. Includes all rights to this turbine design, including license for Fluid Handling Block I and II for the turbine assembly and housing. The NFT includes the blueprints (cad/cam), revenue streams, and all future development of the IT XR Project Redstone... More Info
Infinity Turbine ROT Radial Outflow Turbine 24 Design and Worldwide Rights: NFT for sale... NFT for the ROT 24 energy turbine. Be part of the future with this NFT. This design can be bought and sold but only one design NFT exists. You may manufacture the unit, or get the revenues from its sale from Infinity Turbine. Royalties go to the developer (Infinity) to keep enhancing design and applications... More Info
Infinity Supercritical CO2 10 Liter Extractor Design and Worldwide Rights: The Infinity Supercritical 10L CO2 extractor is for botanical oil extraction, which is rich in terpenes and can produce shelf ready full spectrum oil. With over 5 years of development, this industry leader mature extractor machine has been sold since 2015 and is part of many profitable businesses. The process can also be used for electrowinning, e-waste recycling, and lithium battery recycling, gold mining electronic wastes, precious metals. CO2 can also be used in a reverse fuel cell with nafion to make a gas-to-liquids fuel, such as methanol, ethanol and butanol or ethylene. Supercritical CO2 has also been used for treating nafion to make it more effective catalyst. This NFT is for the purchase of worldwide rights which includes the design. More Info
NFT (Non Fungible Token): Buy our tech, design, development or system NFT and become part of our tech NFT network... More Info
Infinity Turbine Products: Special for this month, any plans are $10,000 for complete Cad/Cam blueprints. License is for one build. Try before you buy a production license. May pay by Bitcoin or other Crypto. Products Page... More Info
| CONTACT TEL: 608-238-6001 Email: greg@infinityturbine.com | RSS | AMP |