PDF Publication Title:
Text from PDF Page: 007
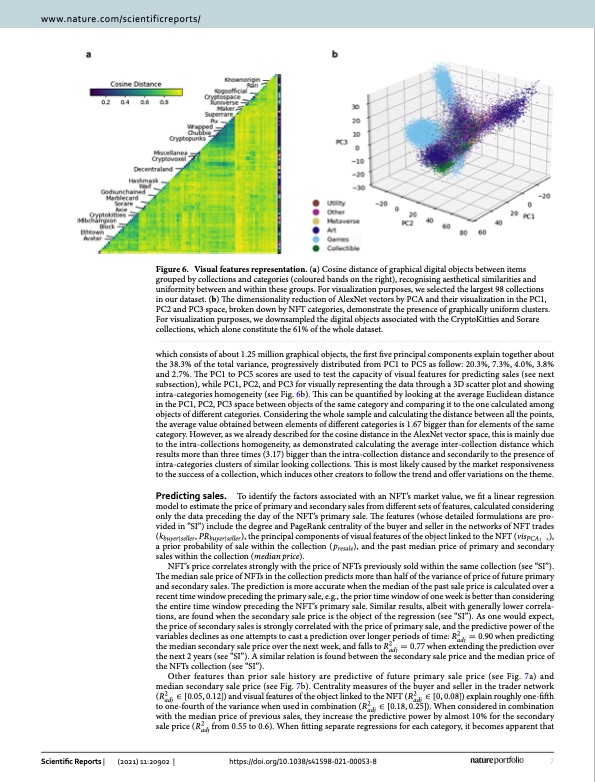
www.nature.com/scientificreports/ Scientific Reports | (2021) 11:20902 | https://doi.org/10.1038/s41598-021-00053-8 7 Vol.:(0123456789) Figure 6. Visual features representation. (a) Cosine distance of graphical digital objects between items grouped by collections and categories (coloured bands on the right), recognising aesthetical similarities and uniformity between and within these groups. For visualization purposes, we selected the largest 98 collections in our dataset. (b) The dimensionality reduction of AlexNet vectors by PCA and their visualization in the PC1, PC2 and PC3 space, broken down by NFT categories, demonstrate the presence of graphically uniform clusters. For visualization purposes, we downsampled the digital objects associated with the CryptoKitties and Sorare collections, which alone constitute the 61% of the whole dataset. which consists of about 1.25 million graphical objects, the first five principal components explain together about the 38.3% of the total variance, progressively distributed from PC1 to PC5 as follow: 20.3%, 7.3%, 4.0%, 3.8% and 2.7%. The PC1 to PC5 scores are used to test the capacity of visual features for predicting sales (see next subsection), while PC1, PC2, and PC3 for visually representing the data through a 3D scatter plot and showing intra-categories homogeneity (see Fig. 6b). This can be quantified by looking at the average Euclidean distance in the PC1, PC2, PC3 space between objects of the same category and comparing it to the one calculated among objects of different categories. Considering the whole sample and calculating the distance between all the points, the average value obtained between elements of different categories is 1.67 bigger than for elements of the same category. However, as we already described for the cosine distance in the AlexNet vector space, this is mainly due to the intra-collections homogeneity, as demonstrated calculating the average inter-collection distance which results more than three times (3.17) bigger than the intra-collection distance and secondarily to the presence of intra-categories clusters of similar looking collections. This is most likely caused by the market responsiveness to the success of a collection, which induces other creators to follow the trend and offer variations on the theme. Predicting sales. To identify the factors associated with an NFT’s market value, we fit a linear regression model to estimate the price of primary and secondary sales from different sets of features, calculated considering only the data preceding the day of the NFT’s primary sale. The features (whose detailed formulations are pro- vided in “SI”) include the degree and PageRank centrality of the buyer and seller in the networks of NFT trades (kbuyer|seller, PRbuyer|seller), the principal components of visual features of the object linked to the NFT (visPCA1...5), a prior probability of sale within the collection (presale), and the past median price of primary and secondary sales within the collection (median price). NFT’s price correlates strongly with the price of NFTs previously sold within the same collection (see “SI”). The median sale price of NFTs in the collection predicts more than half of the variance of price of future primary and secondary sales. The prediction is more accurate when the median of the past sale price is calculated over a recent time window preceding the primary sale, e.g., the prior time window of one week is better than considering the entire time window preceding the NFT’s primary sale. Similar results, albeit with generally lower correla- tions, are found when the secondary sale price is the object of the regression (see “SI”). As one would expect, the price of secondary sales is strongly correlated with the price of primary sale, and the predictive power of the variables declines as one attempts to cast a prediction over longer periods of time: R2 = 0.90 when predicting adj the median secondary sale price over the next week, and falls to R2 = 0.77 when extending the prediction over adj the next 2 years (see “SI”). A similar relation is found between the secondary sale price and the median price of the NFTs collection (see “SI”). Other features than prior sale history are predictive of future primary sale price (see Fig. 7a) and median secondary sale price (see Fig. 7b). Centrality measures of the buyer and seller in the trader network (R2 ∈ [0.05, 0.12]) and visual features of the object linked to the NFT (R2 ∈ [0, 0.08]) explain roughly one-fifth adj adj to one-fourth of the variance when used in combination (R2 ∈ [0.18, 0.25]). When considered in combination adj with the median price of previous sales, they increase the predictive power by almost 10% for the secondary sale price (R2 from 0.55 to 0.6). When fitting separate regressions for each category, it becomes apparent that adjPDF Image | Mapping the NFT revolution
PDF Search Title:
Mapping the NFT revolutionOriginal File Name Searched:
s41598-021-00053-8.pdfDIY PDF Search: Google It | Yahoo | Bing
NFT (Non Fungible Token): Buy our tech, design, development or system NFT and become part of our tech NFT network... More Info
IT XR Project Redstone NFT Available for Sale: NFT for high tech turbine design with one part 3D printed counter-rotating energy turbine. Be part of the future with this NFT. Can be bought and sold but only one design NFT exists. Royalties go to the developer (Infinity) to keep enhancing design and applications... More Info
Infinity Turbine IT XR Project Redstone Design: NFT for sale... NFT for high tech turbine design with one part 3D printed counter-rotating energy turbine. Includes all rights to this turbine design, including license for Fluid Handling Block I and II for the turbine assembly and housing. The NFT includes the blueprints (cad/cam), revenue streams, and all future development of the IT XR Project Redstone... More Info
Infinity Turbine ROT Radial Outflow Turbine 24 Design and Worldwide Rights: NFT for sale... NFT for the ROT 24 energy turbine. Be part of the future with this NFT. This design can be bought and sold but only one design NFT exists. You may manufacture the unit, or get the revenues from its sale from Infinity Turbine. Royalties go to the developer (Infinity) to keep enhancing design and applications... More Info
Infinity Supercritical CO2 10 Liter Extractor Design and Worldwide Rights: The Infinity Supercritical 10L CO2 extractor is for botanical oil extraction, which is rich in terpenes and can produce shelf ready full spectrum oil. With over 5 years of development, this industry leader mature extractor machine has been sold since 2015 and is part of many profitable businesses. The process can also be used for electrowinning, e-waste recycling, and lithium battery recycling, gold mining electronic wastes, precious metals. CO2 can also be used in a reverse fuel cell with nafion to make a gas-to-liquids fuel, such as methanol, ethanol and butanol or ethylene. Supercritical CO2 has also been used for treating nafion to make it more effective catalyst. This NFT is for the purchase of worldwide rights which includes the design. More Info
NFT (Non Fungible Token): Buy our tech, design, development or system NFT and become part of our tech NFT network... More Info
Infinity Turbine Products: Special for this month, any plans are $10,000 for complete Cad/Cam blueprints. License is for one build. Try before you buy a production license. May pay by Bitcoin or other Crypto. Products Page... More Info
| CONTACT TEL: 608-238-6001 Email: greg@infinityturbine.com | RSS | AMP |