PDF Publication Title:
Text from PDF Page: 019
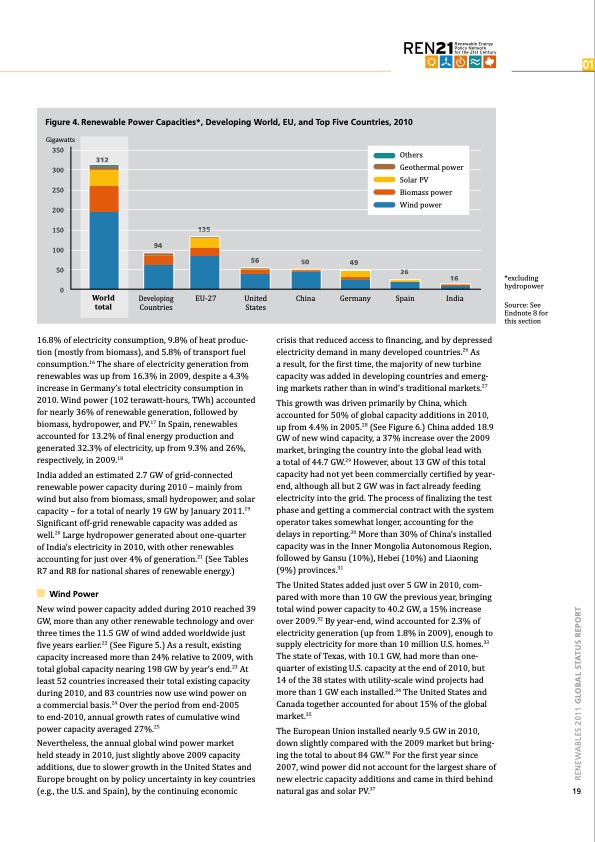
16.8% of electricity consumption, 9.8% of heat produc- tion (mostly from biomass), and 5.8% of transport fuel consumption.16 The share of electricity generation from renewables was up from 16.3% in 2009, despite a 4.3% increase in Germany’s total electricity consumption in 2010. Wind power (102 terawatt-hours, TWh) accounted for nearly 36% of renewable generation, followed by biomass, hydropower, and PV.17 In Spain, renewables accounted for 13.2% of final energy production and generated 32.3% of electricity, up from 9.3% and 26%, respectively, in 2009.18 crisis that reduced access to financing, and by depressed electricity demand in many developed countries.26 As a result, for the first time, the majority of new turbine capacity was added in developing countries and emerg- ing markets rather than in wind’s traditional markets.27 Source: See Endnote 8 for this section India added an estimated 2.7 GW of grid-connected renewable power capacity during 2010 – mainly from wind but also from biomass, small hydropower, and solar capacity – for a total of nearly 19 GW by January 2011.19 Significant off-grid renewable capacity was added as well.20 Large hydropower generated about one-quarter of India’s electricity in 2010, with other renewables accounting for just over 4% of generation.21 (See Tables R7 and R8 for national shares of renewable energy.) This growth was driven primarily by China, which accounted for 50% of global capacity additions in 2010, up from 4.4% in 2005.28 (See Figure 6.) China added 18.9 GW of new wind capacity, a 37% increase over the 2009 market, bringing the country into the global lead with a total of 44.7 GW.29 However, about 13 GW of this total capacity had not yet been commercially certified by year- end, although all but 2 GW was in fact already feeding electricity into the grid. The process of finalizing the test phase and getting a commercial contract with the system operator takes somewhat longer, accounting for the delays in reporting.30 More than 30% of China’s installed capacity was in the Inner Mongolia Autonomous Region, followed by Gansu (10%), Hebei (10%) and Liaoning (9%) provinces.31 New wind power capacity added during 2010 reached 39 GW, more than any other renewable technology and over three times the 11.5 GW of wind added worldwide just five years earlier.22 (See Figure 5.) As a result, existing capacity increased more than 24% relative to 2009, with total global capacity nearing 198 GW by year’s end.23 At least 52 countries increased their total existing capacity during 2010, and 83 countries now use wind power on The United States added just over 5 GW in 2010, com- pared with more than 10 GW the previous year, bringing total wind power capacity to 40.2 GW, a 15% increase over 2009.32 By year-end, wind accounted for 2.3% of electricity generation (up from 1.8% in 2009), enough to supply electricity for more than 10 million U.S. homes.33 The state of Texas, with 10.1 GW, had more than one- quarter of existing U.S. capacity at the end of 2010, but 14 of the 38 states with utility-scale wind projects had more than 1 GW each installed.34 The United States and Canada together accounted for about 15% of the global market.35 n wind Power a commercial basis.24 Over the period from end-2005 to end-2010, annual growth rates of cumulative wind power capacity averaged 27%.25 The European Union installed nearly 9.5 GW in 2010, down slightly compared with the 2009 market but bring- ing the total to about 84 GW.36 For the first year since 2007, wind power did not account for the largest share of new electric capacity additions and came in third behind natural gas and solar PV.37 Nevertheless, the annual global wind power market held steady in 2010, just slightly above 2009 capacity additions, due to slower growth in the United States and Europe brought on by policy uncertainty in key countries (e.g., the U.S. and Spain), by the continuing economic 19 01 figure 4. Renewable Power Capacities*, Developing world, eu, and Top five Countries, 2010 Gigawatts 350 300 312 Others Geothermal power Solar PV Biomass power Wind power 250 200 150 135 100 50 0 94 Developing EU-27 Countries 56 United States 50 49 China Germany 26 Spain 16 India World total *excluding hydropower RENEWABLES 2011 GlObal STaTuS RePORTPDF Image | GLOBAL STATUS REPORT Renewables 2011
PDF Search Title:
GLOBAL STATUS REPORT Renewables 2011Original File Name Searched:
gsr2011.pdfDIY PDF Search: Google It | Yahoo | Bing
NFT (Non Fungible Token): Buy our tech, design, development or system NFT and become part of our tech NFT network... More Info
IT XR Project Redstone NFT Available for Sale: NFT for high tech turbine design with one part 3D printed counter-rotating energy turbine. Be part of the future with this NFT. Can be bought and sold but only one design NFT exists. Royalties go to the developer (Infinity) to keep enhancing design and applications... More Info
Infinity Turbine IT XR Project Redstone Design: NFT for sale... NFT for high tech turbine design with one part 3D printed counter-rotating energy turbine. Includes all rights to this turbine design, including license for Fluid Handling Block I and II for the turbine assembly and housing. The NFT includes the blueprints (cad/cam), revenue streams, and all future development of the IT XR Project Redstone... More Info
Infinity Turbine ROT Radial Outflow Turbine 24 Design and Worldwide Rights: NFT for sale... NFT for the ROT 24 energy turbine. Be part of the future with this NFT. This design can be bought and sold but only one design NFT exists. You may manufacture the unit, or get the revenues from its sale from Infinity Turbine. Royalties go to the developer (Infinity) to keep enhancing design and applications... More Info
Infinity Supercritical CO2 10 Liter Extractor Design and Worldwide Rights: The Infinity Supercritical 10L CO2 extractor is for botanical oil extraction, which is rich in terpenes and can produce shelf ready full spectrum oil. With over 5 years of development, this industry leader mature extractor machine has been sold since 2015 and is part of many profitable businesses. The process can also be used for electrowinning, e-waste recycling, and lithium battery recycling, gold mining electronic wastes, precious metals. CO2 can also be used in a reverse fuel cell with nafion to make a gas-to-liquids fuel, such as methanol, ethanol and butanol or ethylene. Supercritical CO2 has also been used for treating nafion to make it more effective catalyst. This NFT is for the purchase of worldwide rights which includes the design. More Info
NFT (Non Fungible Token): Buy our tech, design, development or system NFT and become part of our tech NFT network... More Info
Infinity Turbine Products: Special for this month, any plans are $10,000 for complete Cad/Cam blueprints. License is for one build. Try before you buy a production license. May pay by Bitcoin or other Crypto. Products Page... More Info
| CONTACT TEL: 608-238-6001 Email: greg@infinityturbine.com | RSS | AMP |