PDF Publication Title:
Text from PDF Page: 003
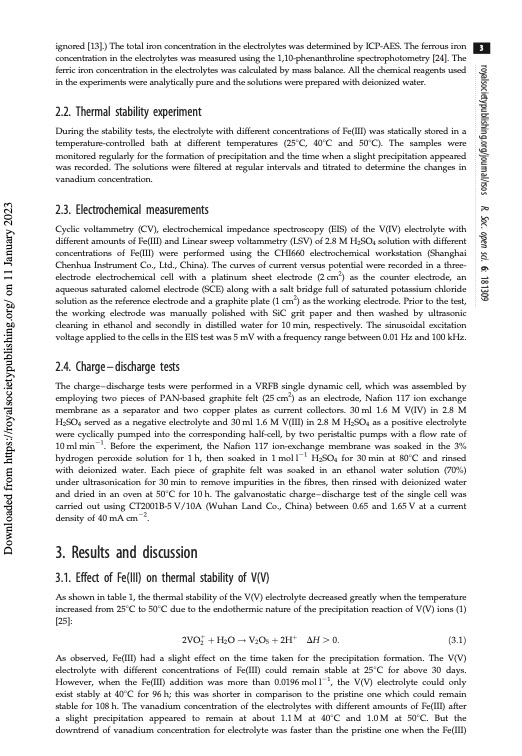
ignored [13].) The total iron concentration in the electrolytes was determined by ICP-AES. The ferrous iron concentration in the electrolytes was measured using the 1,10-phenanthroline spectrophotometry [24]. The ferric iron concentration in the electrolytes was calculated by mass balance. All the chemical reagents used in the experiments were analytically pure and the solutions were prepared with deionized water. 2.2. Thermal stability experiment During the stability tests, the electrolyte with different concentrations of Fe(III) was statically stored in a temperature-controlled bath at different temperatures (258C, 408C and 508C). The samples were monitored regularly for the formation of precipitation and the time when a slight precipitation appeared was recorded. The solutions were filtered at regular intervals and titrated to determine the changes in vanadium concentration. 2.3. Electrochemical measurements Cyclic voltammetry (CV), electrochemical impedance spectroscopy (EIS) of the V(IV) electrolyte with different amounts of Fe(III) and Linear sweep voltammetry (LSV) of 2.8 M H2SO4 solution with different concentrations of Fe(III) were performed using the CHI660 electrochemical workstation (Shanghai Chenhua Instrument Co., Ltd., China). The curves of current versus potential were recorded in a three- electrode electrochemical cell with a platinum sheet electrode (2 cm2) as the counter electrode, an aqueous saturated calomel electrode (SCE) along with a salt bridge full of saturated potassium chloride solution as the reference electrode and a graphite plate (1 cm2) as the working electrode. Prior to the test, the working electrode was manually polished with SiC grit paper and then washed by ultrasonic cleaning in ethanol and secondly in distilled water for 10 min, respectively. The sinusoidal excitation voltage applied to the cells in the EIS test was 5 mV with a frequency range between 0.01 Hz and 100 kHz. 2.4. Charge–discharge tests The charge–discharge tests were performed in a VRFB single dynamic cell, which was assembled by employing two pieces of PAN-based graphite felt (25 cm2) as an electrode, Nafion 117 ion exchange membrane as a separator and two copper plates as current collectors. 30 ml 1.6 M V(IV) in 2.8 M H2SO4 served as a negative electrolyte and 30 ml 1.6 M V(III) in 2.8 M H2SO4 as a positive electrolyte were cyclically pumped into the corresponding half-cell, by two peristaltic pumps with a flow rate of 10 ml min21. Before the experiment, the Nafion 117 ion-exchange membrane was soaked in the 3% hydrogen peroxide solution for 1 h, then soaked in 1 mol l21 H2SO4 for 30 min at 808C and rinsed with deionized water. Each piece of graphite felt was soaked in an ethanol water solution (70%) under ultrasonication for 30 min to remove impurities in the fibres, then rinsed with deionized water and dried in an oven at 508C for 10 h. The galvanostatic charge–discharge test of the single cell was carried out using CT2001B-5 V/10A (Wuhan Land Co., China) between 0.65 and 1.65 V at a current density of 40 mA cm22. 3. Results and discussion 3.1. Effect of Fe(III) on thermal stability of V(V) As shown in table 1, the thermal stability of the V(V) electrolyte decreased greatly when the temperature increased from 258C to 508C due to the endothermic nature of the precipitation reaction of V(V) ions (1) [25]: 2VOþ2 þH2O!V2O5þ2Hþ DH.0: ð3:1Þ As observed, Fe(III) had a slight effect on the time taken for the precipitation formation. The V(V) electrolyte with different concentrations of Fe(III) could remain stable at 258C for above 30 days. However, when the Fe(III) addition was more than 0.0196 mol l21, the V(V) electrolyte could only exist stably at 408C for 96 h; this was shorter in comparison to the pristine one which could remain stable for 108 h. The vanadium concentration of the electrolytes with different amounts of Fe(III) after a slight precipitation appeared to remain at about 1.1M at 408C and 1.0M at 508C. But the downtrend of vanadium concentration for electrolyte was faster than the pristine one when the Fe(III) 3 royalsocietypublishing.org/journal/rsos R. Soc. open sci. 6: 181309 Downloaded from https://royalsocietypublishing.org/ on 11 January 2023PDF Image | Effect of Fe3 positive electrolyte vanadium redox flow

PDF Search Title:
Effect of Fe3 positive electrolyte vanadium redox flowOriginal File Name Searched:
rsos-181309.pdfDIY PDF Search: Google It | Yahoo | Bing
Salgenx Redox Flow Battery Technology: Salt water flow battery technology with low cost and great energy density that can be used for power storage and thermal storage. Let us de-risk your production using our license. Our aqueous flow battery is less cost than Tesla Megapack and available faster. Redox flow battery. No membrane needed like with Vanadium, or Bromine. Salgenx flow battery
| CONTACT TEL: 608-238-6001 Email: greg@salgenx.com | RSS | AMP |