PDF Publication Title:
Text from PDF Page: 004
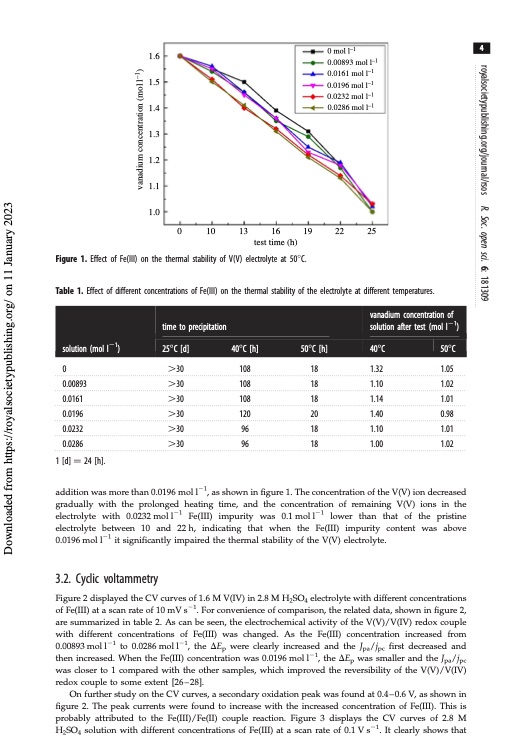
1.6 1.5 1.4 1.3 1.2 1.1 1.0 0 10 13 16 19 22 25 test time (h) Figure 1. Effect of Fe(III) on the thermal stability of V(V) electrolyte at 508C. Table 1. Effect of different concentrations of Fe(III) on the thermal stability of the electrolyte at different temperatures. 1.32 1.10 1.14 1.40 1.10 1.00 0 mol l–1 0.00893 mol l–1 0.0161 mol l–1 0.0196 mol l–1 0.0232 mol l–1 0.0286 mol l–1 4 solution (mol l21) vanadium concentration of time to precipitation solution after test (mol l21) 258C [d] 408C [h] 508C [h] 408C 508C 0 .30 0.00893 .30 0.0161 .30 0.0196 .30 0.0232 .30 0.0286 .30 1 [d] 1⁄4 24 [h]. 108 18 108 18 108 18 120 20 96 18 96 18 1.05 1.02 1.01 0.98 1.01 1.02 addition was more than 0.0196 mol l21, as shown in figure 1. The concentration of the V(V) ion decreased gradually with the prolonged heating time, and the concentration of remaining V(V) ions in the electrolyte with 0.0232 mol l21 Fe(III) impurity was 0.1 mol l21 lower than that of the pristine electrolyte between 10 and 22h, indicating that when the Fe(III) impurity content was above 0.0196 mol l21 it significantly impaired the thermal stability of the V(V) electrolyte. 3.2. Cyclic voltammetry Figure 2 displayed the CV curves of 1.6 M V(IV) in 2.8 M H2SO4 electrolyte with different concentrations of Fe(III) at a scan rate of 10 mV s21. For convenience of comparison, the related data, shown in figure 2, are summarized in table 2. As can be seen, the electrochemical activity of the V(V)/V(IV) redox couple with different concentrations of Fe(III) was changed. As the Fe(III) concentration increased from 0.00893 mol l21 to 0.0286 mol l21, the DEp were clearly increased and the Jpa/jpc first decreased and then increased. When the Fe(III) concentration was 0.0196 mol l21, the DEp was smaller and the Jpa/jpc was closer to 1 compared with the other samples, which improved the reversibility of the V(V)/V(IV) redox couple to some extent [26–28]. On further study on the CV curves, a secondary oxidation peak was found at 0.4–0.6 V, as shown in figure 2. The peak currents were found to increase with the increased concentration of Fe(III). This is probably attributed to the Fe(III)/Fe(II) couple reaction. Figure 3 displays the CV curves of 2.8 M H2SO4 solution with different concentrations of Fe(III) at a scan rate of 0.1 V s21. It clearly shows that royalsocietypublishing.org/journal/rsos R. Soc. open sci. 6: 181309 Downloaded from https://royalsocietypublishing.org/ on 11 January 2023 vanadium concentration (mol l–1)PDF Image | Effect of Fe3 positive electrolyte vanadium redox flow
PDF Search Title:
Effect of Fe3 positive electrolyte vanadium redox flowOriginal File Name Searched:
rsos-181309.pdfDIY PDF Search: Google It | Yahoo | Bing
Salgenx Redox Flow Battery Technology: Salt water flow battery technology with low cost and great energy density that can be used for power storage and thermal storage. Let us de-risk your production using our license. Our aqueous flow battery is less cost than Tesla Megapack and available faster. Redox flow battery. No membrane needed like with Vanadium, or Bromine. Salgenx flow battery
| CONTACT TEL: 608-238-6001 Email: greg@salgenx.com | RSS | AMP |