PDF Publication Title:
Text from PDF Page: 030
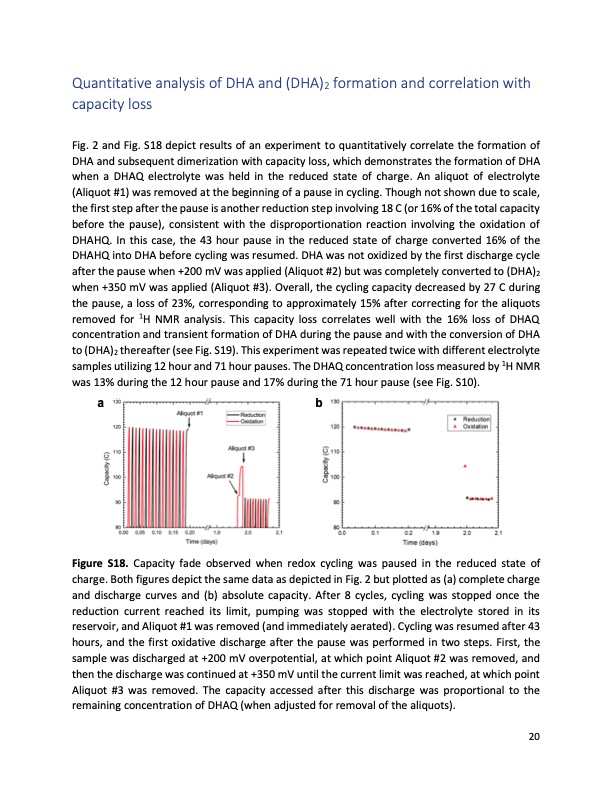
Quantitative analysis of DHA and (DHA)2 formation and correlation with capacity loss Fig. 2 and Fig. S18 depict results of an experiment to quantitatively correlate the formation of DHA and subsequent dimerization with capacity loss, which demonstrates the formation of DHA when a DHAQ electrolyte was held in the reduced state of charge. An aliquot of electrolyte (Aliquot #1) was removed at the beginning of a pause in cycling. Though not shown due to scale, the first step after the pause is another reduction step involving 18 C (or 16% of the total capacity before the pause), consistent with the disproportionation reaction involving the oxidation of DHAHQ. In this case, the 43 hour pause in the reduced state of charge converted 16% of the DHAHQ into DHA before cycling was resumed. DHA was not oxidized by the first discharge cycle after the pause when +200 mV was applied (Aliquot #2) but was completely converted to (DHA)2 when +350 mV was applied (Aliquot #3). Overall, the cycling capacity decreased by 27 C during the pause, a loss of 23%, corresponding to approximately 15% after correcting for the aliquots removed for 1H NMR analysis. This capacity loss correlates well with the 16% loss of DHAQ concentration and transient formation of DHA during the pause and with the conversion of DHA to (DHA)2 thereafter (see Fig. S19). This experiment was repeated twice with different electrolyte samples utilizing 12 hour and 71 hour pauses. The DHAQ concentration loss measured by 1H NMR was 13% during the 12 hour pause and 17% during the 71 hour pause (see Fig. S10). ab Figure S18. Capacity fade observed when redox cycling was paused in the reduced state of charge. Both figures depict the same data as depicted in Fig. 2 but plotted as (a) complete charge and discharge curves and (b) absolute capacity. After 8 cycles, cycling was stopped once the reduction current reached its limit, pumping was stopped with the electrolyte stored in its reservoir, and Aliquot #1 was removed (and immediately aerated). Cycling was resumed after 43 hours, and the first oxidative discharge after the pause was performed in two steps. First, the sample was discharged at +200 mV overpotential, at which point Aliquot #2 was removed, and then the discharge was continued at +350 mV until the current limit was reached, at which point Aliquot #3 was removed. The capacity accessed after this discharge was proportional to the remaining concentration of DHAQ (when adjusted for removal of the aliquots). 20PDF Image | Extending organic flow batteries via redox state management
PDF Search Title:
Extending organic flow batteries via redox state managementOriginal File Name Searched:
mja287.pdfDIY PDF Search: Google It | Yahoo | Bing
Salgenx Redox Flow Battery Technology: Salt water flow battery technology with low cost and great energy density that can be used for power storage and thermal storage. Let us de-risk your production using our license. Our aqueous flow battery is less cost than Tesla Megapack and available faster. Redox flow battery. No membrane needed like with Vanadium, or Bromine. Salgenx flow battery
| CONTACT TEL: 608-238-6001 Email: greg@salgenx.com | RSS | AMP |