PDF Publication Title:
Text from PDF Page: 123
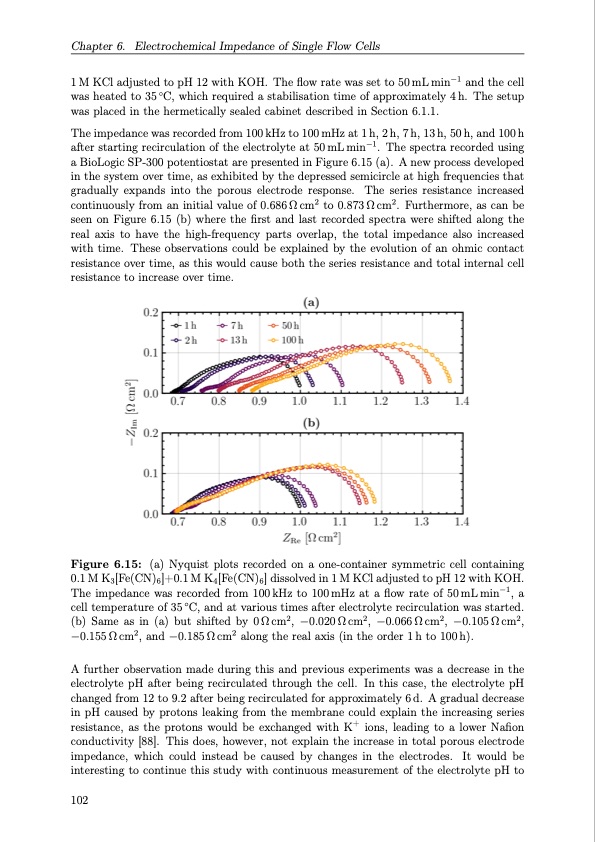
Chapter 6. Electrochemical Impedance of Single Flow Cells 1 M KCl adjusted to pH 12 with KOH. The flow rate was set to 50 mL min−1 and the cell was heated to 35 ◦C, which required a stabilisation time of approximately 4 h. The setup was placed in the hermetically sealed cabinet described in Section 6.1.1. The impedance was recorded from 100kHz to 100mHz at 1h, 2h, 7h, 13h, 50h, and 100h after starting recirculation of the electrolyte at 50 mL min−1. The spectra recorded using a BioLogic SP-300 potentiostat are presented in Figure 6.15 (a). A new process developed in the system over time, as exhibited by the depressed semicircle at high frequencies that gradually expands into the porous electrode response. The series resistance increased continuously from an initial value of 0.686 Ω cm2 to 0.873 Ω cm2. Furthermore, as can be seen on Figure 6.15 (b) where the first and last recorded spectra were shifted along the real axis to have the high-frequency parts overlap, the total impedance also increased with time. These observations could be explained by the evolution of an ohmic contact resistance over time, as this would cause both the series resistance and total internal cell resistance to increase over time. Figure 6.15: (a) Nyquist plots recorded on a one-container symmetric cell containing 0.1 M K3[Fe(CN)6]+0.1 M K4[Fe(CN)6] dissolved in 1 M KCl adjusted to pH 12 with KOH. The impedance was recorded from 100kHz to 100mHz at a flow rate of 50mLmin−1, a cell temperature of 35 ◦C, and at various times after electrolyte recirculation was started. (b) Same as in (a) but shifted by 0Ωcm2, −0.020Ωcm2, −0.066Ωcm2, −0.105Ωcm2, −0.155 Ω cm2, and −0.185 Ω cm2 along the real axis (in the order 1 h to 100 h). A further observation made during this and previous experiments was a decrease in the electrolyte pH after being recirculated through the cell. In this case, the electrolyte pH changed from 12 to 9.2 after being recirculated for approximately 6 d. A gradual decrease in pH caused by protons leaking from the membrane could explain the increasing series resistance, as the protons would be exchanged with K+ ions, leading to a lower Nafion conductivity [88]. This does, however, not explain the increase in total porous electrode impedance, which could instead be caused by changes in the electrodes. It would be interesting to continue this study with continuous measurement of the electrolyte pH to 102PDF Image | Organic Redox Flow Batteries 2023
PDF Search Title:
Organic Redox Flow Batteries 2023Original File Name Searched:
PhD_thesis_final_dorhoff_4_.pdfDIY PDF Search: Google It | Yahoo | Bing
Salgenx Redox Flow Battery Technology: Salt water flow battery technology with low cost and great energy density that can be used for power storage and thermal storage. Let us de-risk your production using our license. Our aqueous flow battery is less cost than Tesla Megapack and available faster. Redox flow battery. No membrane needed like with Vanadium, or Bromine. Salgenx flow battery
| CONTACT TEL: 608-238-6001 Email: greg@salgenx.com | RSS | AMP |