PDF Publication Title:
Text from PDF Page: 002
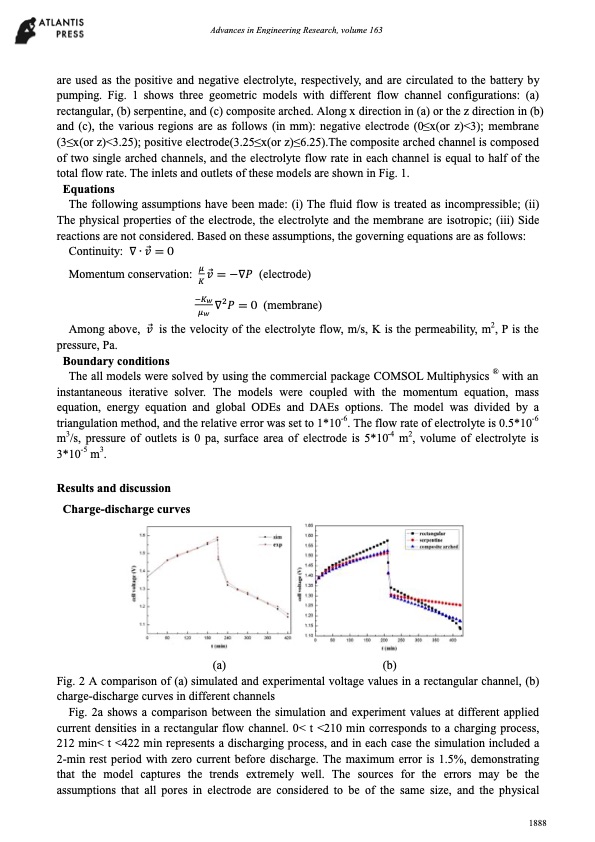
Advances in Engineering Research, volume 163 are used as the positive and negative electrolyte, respectively, and are circulated to the battery by pumping. Fig. 1 shows three geometric models with different flow channel configurations: (a) rectangular, (b) serpentine, and (c) composite arched. Along x direction in (a) or the z direction in (b) and (c), the various regions are as follows (in mm): negative electrode (0≤x(or z)<3); membrane (3≤x(or z)<3.25); positive electrode(3.25≤x(or z)≤6.25).The composite arched channel is composed of two single arched channels, and the electrolyte flow rate in each channel is equal to half of the total flow rate. The inlets and outlets of these models are shown in Fig. 1. Equations The following assumptions have been made: (i) The fluid flow is treated as incompressible; (ii) The physical properties of the electrode, the electrolyte and the membrane are isotropic; (iii) Side reactions are not considered. Based on these assumptions, the governing equations are as follows: Continuity: ∇ ∙ ⃗ = 0 Momentum conservation: ⃗ = −∇ (electrode) ∇ = 0 (membrane) Among above, ⃗ is the velocity of the electrolyte flow, m/s, K is the permeability, m2, P is the pressure, Pa. Boundary conditions The all models were solved by using the commercial package COMSOL Multiphysics ® with an instantaneous iterative solver. The models were coupled with the momentum equation, mass equation, energy equation and global ODEs and DAEs options. The model was divided by a triangulation method, and the relative error was set to 1*10-6. The flow rate of electrolyte is 0.5*10-6 m3/s, pressure of outlets is 0 pa, surface area of electrode is 5*10-4 m2, volume of electrolyte is 3*10-5 m3. Results and discussion Charge-discharge curves (a) (b) Fig. 2 A comparison of (a) simulated and experimental voltage values in a rectangular channel, (b) charge-discharge curves in different channels Fig. 2a shows a comparison between the simulation and experiment values at different applied current densities in a rectangular flow channel. 0< t <210 min corresponds to a charging process, 212 min< t <422 min represents a discharging process, and in each case the simulation included a 2-min rest period with zero current before discharge. The maximum error is 1.5%, demonstrating that the model captures the trends extremely well. The sources for the errors may be the assumptions that all pores in electrode are considered to be of the same size, and the physical 1888PDF Image | Simulation all-vanadium redox flow battery arched channel
PDF Search Title:
Simulation all-vanadium redox flow battery arched channelOriginal File Name Searched:
25894955.pdfDIY PDF Search: Google It | Yahoo | Bing
Salgenx Redox Flow Battery Technology: Salt water flow battery technology with low cost and great energy density that can be used for power storage and thermal storage. Let us de-risk your production using our license. Our aqueous flow battery is less cost than Tesla Megapack and available faster. Redox flow battery. No membrane needed like with Vanadium, or Bromine. Salgenx flow battery
| CONTACT TEL: 608-238-6001 Email: greg@salgenx.com | RSS | AMP |