PDF Publication Title:
Text from PDF Page: 004
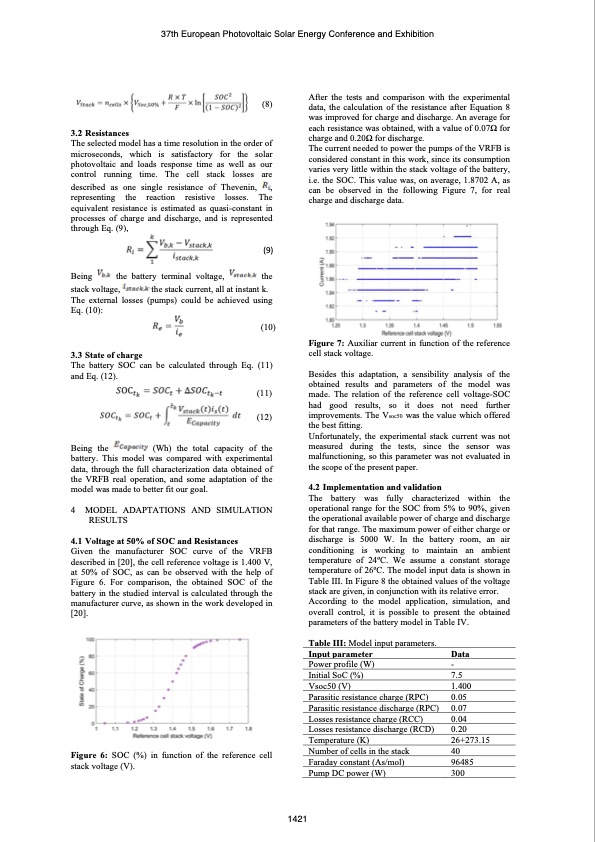
3.2 Resistances 37th European Photovoltaic Solar Energy Conference and Exhibition The selected model has a time resolution in the order of microseconds, which is satisfactory for the solar photovoltaic and loads response time as well as our control running time. The cell stack losses are described as one single resistance of Thevenin, , representing the reaction resistive losses. The equivalent resistance is estimated as quasi-constant in processes of charge and discharge, and is represented through Eq. (9), (9) Being the battery terminal voltage, the stack voltage, the stack current, all at instant k. The external losses (pumps) could be achieved using Eq. (10): (10) 3.3 State of charge The battery SOC can be calculated through Eq. (11) and Eq. (12). (11) (12) Being the (Wh) the total capacity of the battery. This model was compared with experimental data, through the full characterization data obtained of the VRFB real operation, and some adaptation of the model was made to better fit our goal. 4 MODEL ADAPTATIONS AND SIMULATION RESULTS 4.1 Voltage at 50% of SOC and Resistances Given the manufacturer SOC curve of the VRFB described in [20], the cell reference voltage is 1.400 V, at 50% of SOC, as can be observed with the help of Figure 6. For comparison, the obtained SOC of the battery in the studied interval is calculated through the manufacturer curve, as shown in the work developed in [20]. Figure 7: Auxiliar current in function of the reference cell stack voltage. Besides this adaptation, a sensibility analysis of the obtained results and parameters of the model was made. The relation of the reference cell voltage-SOC had good results, so it does not need further improvements. The Vsoc50 was the value which offered the best fitting. Unfortunately, the experimental stack current was not measured during the tests, since the sensor was malfunctioning, so this parameter was not evaluated in the scope of the present paper. 4.2 Implementation and validation The battery was fully characterized within the operational range for the SOC from 5% to 90%, given the operational available power of charge and discharge for that range. The maximum power of either charge or discharge is 5000 W. In the battery room, an air conditioning is working to maintain an ambient temperature of 24oC. We assume a constant storage temperature of 26oC. The model input data is shown in Table III. In Figure 8 the obtained values of the voltage stack are given, in conjunction with its relative error. According to the model application, simulation, and overall control, it is possible to present the obtained parameters of the battery model in Table IV. Table III: Model input parameters. Input parameter Data Power profile (W) - Initial SoC (%) 7.5 Vsoc50 (V) 1.400 Parasitic resistance charge (RPC) 0.05 Parasitic resistance discharge (RPC) 0.07 Losses resistance charge (RCC) 0.04 Losses resistance discharge (RCD) 0.20 Temperature (K) 26+273.15 Number of cells in the stack 40 Faraday constant (As/mol) 96485 Pump DC power (W) 300 (8) After the tests and comparison with the experimental data, the calculation of the resistance after Equation 8 was improved for charge and discharge. An average for each resistance was obtained, with a value of 0.07Ω for charge and 0.20Ω for discharge. The current needed to power the pumps of the VRFB is considered constant in this work, since its consumption varies very little within the stack voltage of the battery, i.e. the SOC. This value was, on average, 1.8702 A, as can be observed in the following Figure 7, for real charge and discharge data. Figure 6: SOC (%) in function of the reference cell stack voltage (V). 1421PDF Image | VANADIUM REDOX FLOW BATTERY MODELLING
PDF Search Title:
VANADIUM REDOX FLOW BATTERY MODELLINGOriginal File Name Searched:
Vanadium-Redox-Flow-Battery-Modelling.pdfDIY PDF Search: Google It | Yahoo | Bing
Salgenx Redox Flow Battery Technology: Salt water flow battery technology with low cost and great energy density that can be used for power storage and thermal storage. Let us de-risk your production using our license. Our aqueous flow battery is less cost than Tesla Megapack and available faster. Redox flow battery. No membrane needed like with Vanadium, or Bromine. Salgenx flow battery
| CONTACT TEL: 608-238-6001 Email: greg@salgenx.com | RSS | AMP |