PDF Publication Title:
Text from PDF Page: 010
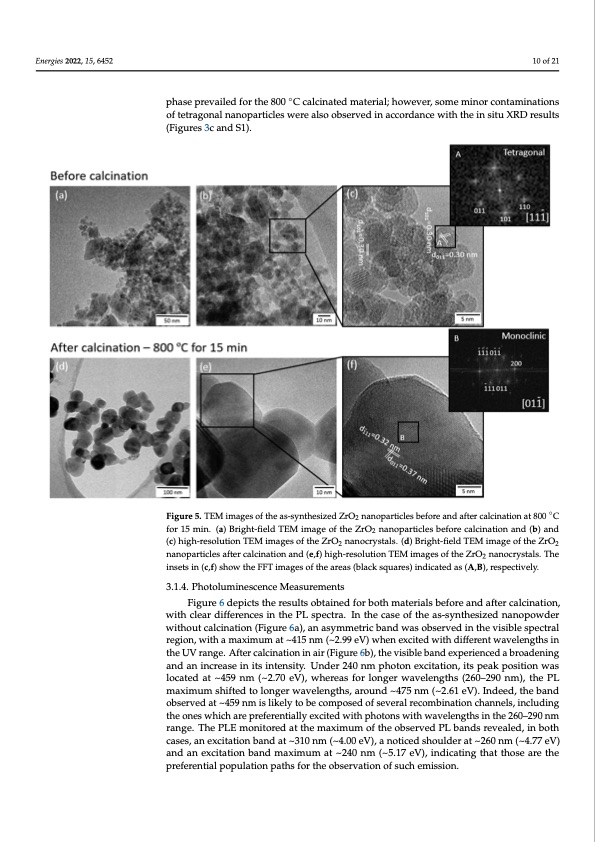
Energies 2022, 15, 6452 nanoparticles before calcination demonstrate the presence of heterogeneous particles with an average particle size of 6.7 ± 1.9 nm. Abnormal large particles were also observed (Figure 5a,b). In terms of particle shape, microwave synthesis resulted in different nanostructures, including nanospheres, nanosquares and irregular-shaped nanoparticles. The heterogeneity detected is consistent with the XRD and Raman spectroscopy results, with the presence of both tetragonal and monoclinic ZrO2 phases (Figures 2a and 3a). The lattice spacing of 0.3 nm measured in Figure 5c was consistent with the d-spacing of the where it was shown that after microwave synthesis, there was a mixture of ZrO2 phases, (FFT) image carried out through the [111] zone axis, attested the existence of pure of tetragonal nanoparticles were also observed in accordance with the in situ XRD results tetragonal ZrO2 nanocrystals. (Figures 3c and S1). 10 of 21 (101) and (011) planes of the tetragonal ZrO2. Furthermore, the fast Fourier transform phase prevailed for the 800 ◦C calcinated material; however, some minor contaminations Figure 5. TEM images of the as-synthesized ZrO2 nanoparticles before and after calcination at 800◦ Figure 5. TEM images of the as-synthesized ZrO2 nanoparticles before and after calcination at 800 C °C for 15 min. (a) Bright-field TEM image of the ZrO2 nanoparticles before calcination and (b) and for 15 min. (a) Bright-field TEM image of the ZrO2 nanoparticles before calcination and (b) and (c) high-resolution TEM images of the ZrO2 nanocrystals. (d) Bright-field TEM image of the ZrO2 (c) high-resolution TEM images of the ZrO2 nanocrystals. (d) Bright-field TEM image of the ZrO2 nanoparticles after calcination and (e,f) high-resolution TEM images of the ZrO2 nanocrystals. The insets in (c,f) show the FFT images of the areas (black squares) indicated as (A,B), respectively. 3.1.4. Photoluminescence Measurements Figure 6 depicts the results obtained for both materials before and after calcination, with clear differences in the PL spectra. In the case of the as-synthesized nanopowder without calcination (Figure 6a), an asymmetric band was observed in the visible spectral region, with a maximum at ~415 nm (~2.99 eV) when excited with different wavelengths in the UV range. After calcination in air (Figure 6b), the visible band experienced a broadening and an increase in its intensity. Under 240 nm photon excitation, its peak position was located at ~459 nm (~2.70 eV), whereas for longer wavelengths (260–290 nm), the PL maximum shifted to longer wavelengths, around ~475 nm (~2.61 eV). Indeed, the band observed at ~459 nm is likely to be composed of several recombination channels, including the ones which are preferentially excited with photons with wavelengths in the 260–290 nm range. The PLE monitored at the maximum of the observed PL bands revealed, in both cases, an excitation band at ~310 nm (~4.00 eV), a noticed shoulder at ~260 nm (~4.77 eV) and an excitation band maximum at ~240 nm (~5.17 eV), indicating that those are the preferential population paths for the observation of such emission.PDF Image | Comparison between Solution-Based Synthesis Methods of ZrO2
PDF Search Title:
Comparison between Solution-Based Synthesis Methods of ZrO2Original File Name Searched:
energies-15-06452.pdfDIY PDF Search: Google It | Yahoo | Bing
Turbine and System Plans CAD CAM: Special for this month, any plans are $10,000 for complete Cad/Cam blueprints. License is for one build. Try before you buy a production license. More Info
Waste Heat Power Technology: Organic Rankine Cycle uses waste heat to make electricity, shaft horsepower and cooling. More Info
All Turbine and System Products: Infinity Turbine ORD systems, turbine generator sets, build plans and more to use your waste heat from 30C to 100C. More Info
CO2 Phase Change Demonstrator: CO2 goes supercritical at 30 C. This is a experimental platform which you can use to demonstrate phase change with low heat. Includes integration area for small CO2 turbine, static generator, and more. This can also be used for a GTL Gas to Liquids experimental platform. More Info
Introducing the Infinity Turbine Products Infinity Turbine develops and builds systems for making power from waste heat. It also is working on innovative strategies for storing, making, and deploying energy. More Info
Need Strategy? Use our Consulting and analyst services Infinity Turbine LLC is pleased to announce its consulting and analyst services. We have worked in the renewable energy industry as a researcher, developing sales and markets, along with may inventions and innovations. More Info
Made in USA with Global Energy Millennial Web Engine These pages were made with the Global Energy Web PDF Engine using Filemaker (Claris) software.
Sand Battery Sand and Paraffin for TES Thermo Energy Storage More Info
| CONTACT TEL: 608-238-6001 Email: greg@infinityturbine.com | RSS | AMP |