PDF Publication Title:
Text from PDF Page: 009
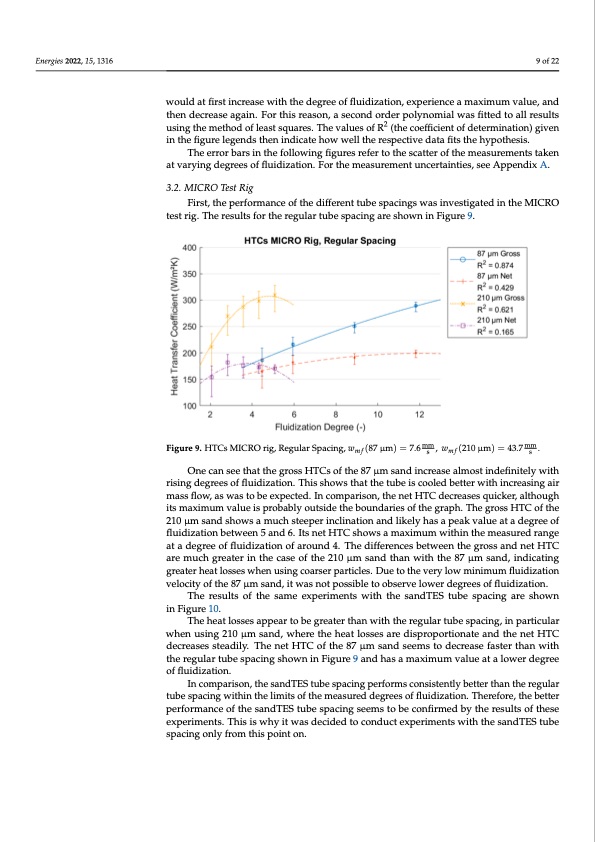
Energies 2022, 15, 1316 configurations and different particle sizes. Developing new correlations for the heat transfer coefficient between a tube’s outer surface and the surrounding fluidized bed (e.g., for finned tubes) is outside the scope of this investigation. However, to help the reader to interpret the results, regression curves are introduced in all graphs. The underlying hypothesis of all experiments is that the heat transfer coefficient would at first increase with the degree of fluidization, experience a maximum would at first increase with the degree of fluidization, experience a maximum value, and all results using the method of least squares. The values of R2 (the coefficient of then decrease again. For this reason, a second order polynomial was fitted to all results determination) given in the figure legends then indicate how well the respective data fits using the method of least squares. The values of R2 (the coefficient of determination) given the hypothesis. 9 of 22 value, and then decrease again. For this reason, a second order polynomial was fitted to in the figure legends then indicate how well the respective data fits the hypothesis. The error bars in the following figures refer to the scatter of the measurements taken The error bars in the following figures refer to the scatter of the measurements taken at varying degrees of fluidization. For the measurement uncertainties, see Appendix A. at varying degrees of fluidization. For the measurement uncertainties, see Appendix A. 3.2. MICRO Test Rig 3.2. MICRO Test Rig First, the performance of the different tube spacings was investigated in the MICRO First, the performance of the different tube spacings was investigated in the MICRO test rig. The results for the regular tube spacing are shown in Figure 9. test rig. The results for the regular tube spacing are shown in Figure 9. Figure 9. HTCs MICRO rig, Regular Spacing, 𝑤 (87 μ𝑚) = 7.6 mm, 𝑤 (210 μ𝑚) = 43.7 m.m Figure9.HTCsMICROrig,RegularSpacing,w (87μm)=7.6 ,w (210μm)=43.7 . mf smf s One can see that the gross HTCs of the 87 μm sand increase almost indefinitely with One can see that the gross HTCs of the 87 μm sand increase almost indefinitely with rising degrees of fluidization. This shows that the tube is cooled better with increasing air rising degrees of fluidization. This shows that the tube is cooled better with increasing air mass flow, as was to be expected. In comparison, the net HTC decreases quicker, although mass flow, as was to be expected. In comparison, the net HTC decreases quicker, although its maximum value is probably outside the boundaries of the graph. The gross HTC of the its maximum value is probably outside the boundaries of the graph. The gross HTC of the 210 μm sand shows a much steeper inclination and likely has a peak value at a degree of 210 μm sand shows a much steeper inclination and likely has a peak value at a degree of fluidization between 5 and 6. Its net HTC shows a maximum within the measured range fluidization between 5 and 6. Its net HTC shows a maximum within the measured range at a degree of fluidization of around 4. The differences between the gross and net HTC at a degree of fluidization of around 4. The differences between the gross and net HTC are are much greater in the case of the 210 μm sand than with the 87 μm sand, indicating much greater in the case of the 210 μm sand than with the 87 μm sand, indicating greater greater heat losses when using coarser particles. Due to the very low minimum fluidization heat losses when using coarser particles. Due to the very low minimum fluidization velocity of the 87 μm sand, it was not possible to observe lower degrees of fluidization. velocity of the 87 μm sand, it was not possible to observe lower degrees of fluidization. The results of the same experiments with the sandTES tube spacing are shown The results of the same experiments with the sandTES tube spacing are shown in in Figure 10. Figure 10. The heat losses appear to be greater than with the regular tube spacing, in particular when using 210 μm sand, where the heat losses are disproportionate and the net HTC decreases steadily. The net HTC of the 87 μm sand seems to decrease faster than with the regular tube spacing shown in Figure 9 and has a maximum value at a lower degree of fluidization. In comparison, the sandTES tube spacing performs consistently better than the regular tube spacing within the limits of the measured degrees of fluidization. Therefore, the better performance of the sandTES tube spacing seems to be confirmed by the results of these experiments. This is why it was decided to conduct experiments with the sandTES tube spacing only from this point on. PDF Image | Heat Transfer between Finned Tubes
PDF Search Title:
Heat Transfer between Finned TubesOriginal File Name Searched:
energies-15-01316.pdfDIY PDF Search: Google It | Yahoo | Bing
Turbine and System Plans CAD CAM: Special for this month, any plans are $10,000 for complete Cad/Cam blueprints. License is for one build. Try before you buy a production license. More Info
Waste Heat Power Technology: Organic Rankine Cycle uses waste heat to make electricity, shaft horsepower and cooling. More Info
All Turbine and System Products: Infinity Turbine ORD systems, turbine generator sets, build plans and more to use your waste heat from 30C to 100C. More Info
CO2 Phase Change Demonstrator: CO2 goes supercritical at 30 C. This is a experimental platform which you can use to demonstrate phase change with low heat. Includes integration area for small CO2 turbine, static generator, and more. This can also be used for a GTL Gas to Liquids experimental platform. More Info
Introducing the Infinity Turbine Products Infinity Turbine develops and builds systems for making power from waste heat. It also is working on innovative strategies for storing, making, and deploying energy. More Info
Need Strategy? Use our Consulting and analyst services Infinity Turbine LLC is pleased to announce its consulting and analyst services. We have worked in the renewable energy industry as a researcher, developing sales and markets, along with may inventions and innovations. More Info
Made in USA with Global Energy Millennial Web Engine These pages were made with the Global Energy Web PDF Engine using Filemaker (Claris) software.
Sand Battery Sand and Paraffin for TES Thermo Energy Storage More Info
| CONTACT TEL: 608-238-6001 Email: greg@infinityturbine.com | RSS | AMP |