PDF Publication Title:
Text from PDF Page: 018
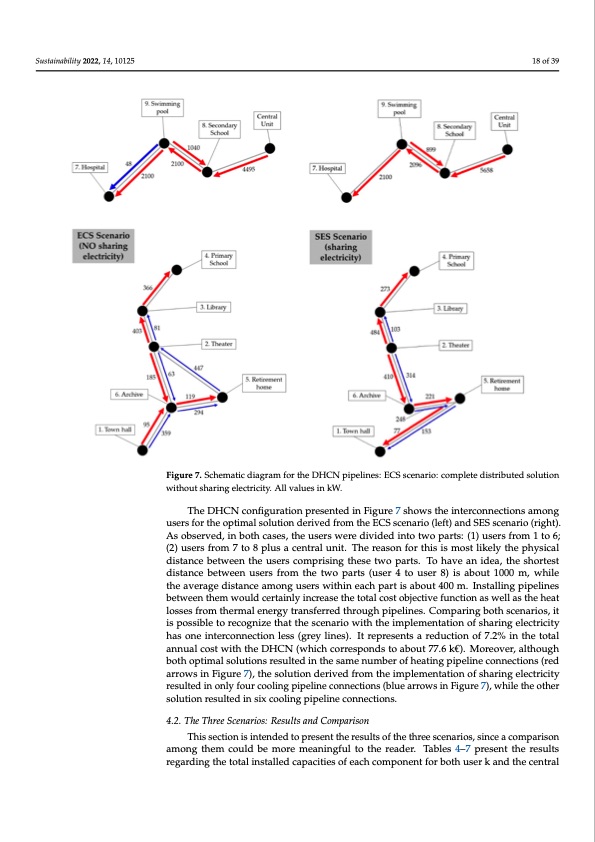
Figure 6. Superstructure for the complete distributed solution without sharing electricity. Sustainability 2022, 14, 10125 As specified in Section 3, the EC comprises nine users distributed throughout the city centre of Pordenone, Italy (Figure 3). The simulated ECS and SES scenarios also provided an optimal configuration for the pipelines of the DHCN (Figure 7), i.e., based on the min- imization of the economic objective function, the optimizer decided which users c1a8nofb3e9 interconnected and the amount of energy transferred through these pipelines. Figure 7. Schematic diagram for the DHCN pipelines: ECS scenario: complete distributed solution Figure 7. Schematic diagram for the DHCN pipelines: ECS scenario: complete distributed solution wiitthouttshariingellectriiciity. All values in kW. The DHCN configuration presented in Figure 7 shows the interconnections among The DHCN configuration presented in Figure 7 shows the interconnections among users for the optimal solution derived from the ECS scenario (left) and SES scenario (right). users for the optimal solution derived from the ECS scenario (left) and SES scenario As observed, in both cases, the users were divided into two parts: (1) users from 1 to 6; (right). As observed, in both cases, the users were divided into two parts: (1) users from 1 (2) users from 7 to 8 plus a central unit. The reason for this is most likely the physical to 6; (2) users from 7 to 8 plus a central unit. The reason for this is most likely the physical distance between the users comprising these two parts. To have an idea, the shortest distance between the users comprising these two parts. To have an idea, the shortest dis- distance between users from the two parts (user 4 to user 8) is about 1000 m, while tance between users from the two parts (user 4 to user 8) is about 1000 m, while the aver- the average distance among users within each part is about 400 m. Installing pipelines age distance among users within each part is about 400 m. Installing pipelines between between them would certainly increase the total cost objective function as well as the heat them would certainly increase the total cost objective function as well as the heat losses losses from thermal energy transferred through pipelines. Comparing both scenarios, it from thermal energy transferred through pipelines. Comparing both scenarios, it is pos- is possible to recognize that the scenario with the implementation of sharing electricity sible to recognize that the scenario with the implementation of sharing electricity has one has one interconnection less (grey lines). It represents a reduction of 7.2% in the total interconnection less (grey lines). It represents a reduction of 7.2% in the total annual cost annual cost with the DHCN (which corresponds to about 77.6 k€). Moreover, although with the DHCN (which corresponds to about 77.6 k€). Moreover, although both optimal both optimal solutions resulted in the same number of heating pipeline connections (red solutions resulted in the same number of heating pipeline connections (red arrows in Fig- arrows in Figure 7), the solution derived from the implementation of sharing electricity ure 7), the solution derived from the implementation of sharing electricity resulted in only resulted in only four cooling pipeline connections (blue arrows in Figure 7), while the other solution resulted in six cooling pipeline connections. 4.2. The Three Scenarios: Results and Comparison This section is intended to present the results of the three scenarios, since a comparison among them could be more meaningful to the reader. Tables 4–7 present the results regarding the total installed capacities of each component for both user k and the centralPDF Image | Optimal Sharing Electricity and Thermal Energy
PDF Search Title:
Optimal Sharing Electricity and Thermal EnergyOriginal File Name Searched:
sustainability-14-10125-v2.pdfDIY PDF Search: Google It | Yahoo | Bing
Turbine and System Plans CAD CAM: Special for this month, any plans are $10,000 for complete Cad/Cam blueprints. License is for one build. Try before you buy a production license. More Info
Waste Heat Power Technology: Organic Rankine Cycle uses waste heat to make electricity, shaft horsepower and cooling. More Info
All Turbine and System Products: Infinity Turbine ORD systems, turbine generator sets, build plans and more to use your waste heat from 30C to 100C. More Info
CO2 Phase Change Demonstrator: CO2 goes supercritical at 30 C. This is a experimental platform which you can use to demonstrate phase change with low heat. Includes integration area for small CO2 turbine, static generator, and more. This can also be used for a GTL Gas to Liquids experimental platform. More Info
Introducing the Infinity Turbine Products Infinity Turbine develops and builds systems for making power from waste heat. It also is working on innovative strategies for storing, making, and deploying energy. More Info
Need Strategy? Use our Consulting and analyst services Infinity Turbine LLC is pleased to announce its consulting and analyst services. We have worked in the renewable energy industry as a researcher, developing sales and markets, along with may inventions and innovations. More Info
Made in USA with Global Energy Millennial Web Engine These pages were made with the Global Energy Web PDF Engine using Filemaker (Claris) software.
Sand Battery Sand and Paraffin for TES Thermo Energy Storage More Info
| CONTACT TEL: 608-238-6001 Email: greg@infinityturbine.com | RSS | AMP |