PDF Publication Title:
Text from PDF Page: 020
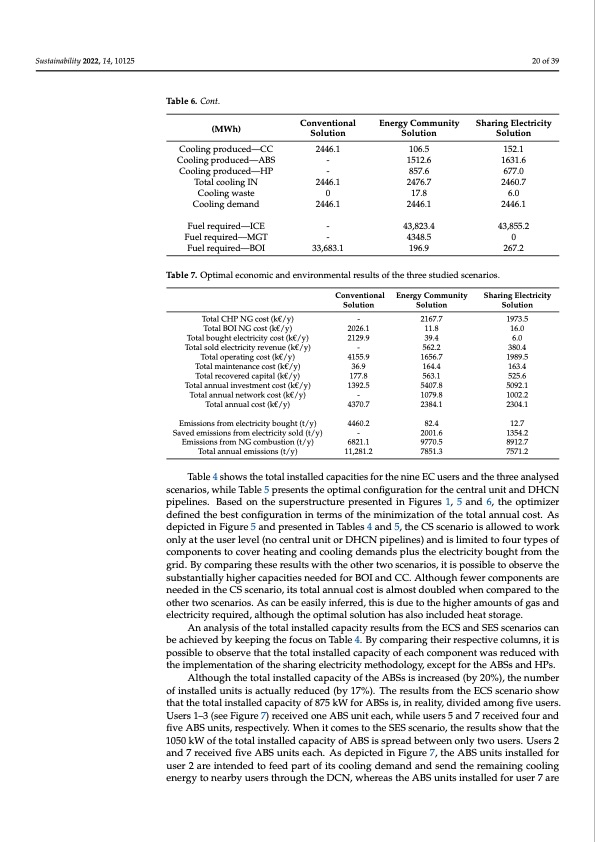
Sustainability 2022, 14, 10125 20 of 39 Table 6. Cont. (MWh) Cooling produced—CC Cooling produced—ABS Cooling produced—HP Total cooling IN Cooling waste Cooling demand Fuel required—ICE Fuel required—MGT Fuel required—BOI Conventional Energy Community Solution Solution 2446.1 106.5 - 1512.6 - 857.6 2446.1 2476.7 0 17.8 2446.1 2446.1 - 43,823.4 - 4348.5 33,683.1 196.9 Sharing Electricity Solution 152.1 1631.6 677.0 2460.7 6.0 2446.1 43,855.2 0 267.2 Table 7. Optimal economic and environmental results of the three studied scenarios. Total CHP NG cost (k€/y) Total BOI NG cost (k€/y) Total bought electricity cost (k€/y) Total sold electricity revenue (k€/y) Total operating cost (k€/y) Total maintenance cost (k€/y) Total recovered capital (k€/y) Total annual investment cost (k€/y) Total annual network cost (k€/y) Total annual cost (k€/y) Emissions from electricity bought (t/y) Saved emissions from electricity sold (t/y) Emissions from NG combustion (t/y) Total annual emissions (t/y) Conventional Solution - 2026.1 2129.9 - 4155.9 36.9 177.8 1392.5 - 4370.7 4460.2 - 6821.1 11,281.2 Energy Community Solution 2167.7 11.8 39.4 562.2 1656.7 164.4 563.1 5407.8 1079.8 2384.1 82.4 2001.6 9770.5 7851.3 Sharing Electricity Solution 1973.5 16.0 6.0 380.4 1989.5 163.4 525.6 5092.1 1002.2 2304.1 12.7 1354.2 8912.7 7571.2 Table 4 shows the total installed capacities for the nine EC users and the three analysed scenarios, while Table 5 presents the optimal configuration for the central unit and DHCN pipelines. Based on the superstructure presented in Figures 1, 5 and 6, the optimizer defined the best configuration in terms of the minimization of the total annual cost. As depicted in Figure 5 and presented in Tables 4 and 5, the CS scenario is allowed to work only at the user level (no central unit or DHCN pipelines) and is limited to four types of components to cover heating and cooling demands plus the electricity bought from the grid. By comparing these results with the other two scenarios, it is possible to observe the substantially higher capacities needed for BOI and CC. Although fewer components are needed in the CS scenario, its total annual cost is almost doubled when compared to the other two scenarios. As can be easily inferred, this is due to the higher amounts of gas and electricity required, although the optimal solution has also included heat storage. An analysis of the total installed capacity results from the ECS and SES scenarios can be achieved by keeping the focus on Table 4. By comparing their respective columns, it is possible to observe that the total installed capacity of each component was reduced with the implementation of the sharing electricity methodology, except for the ABSs and HPs. Although the total installed capacity of the ABSs is increased (by 20%), the number of installed units is actually reduced (by 17%). The results from the ECS scenario show that the total installed capacity of 875 kW for ABSs is, in reality, divided among five users. Users 1–3 (see Figure 7) received one ABS unit each, while users 5 and 7 received four and five ABS units, respectively. When it comes to the SES scenario, the results show that the 1050 kW of the total installed capacity of ABS is spread between only two users. Users 2 and 7 received five ABS units each. As depicted in Figure 7, the ABS units installed for user 2 are intended to feed part of its cooling demand and send the remaining cooling energy to nearby users through the DCN, whereas the ABS units installed for user 7 arePDF Image | Optimal Sharing Electricity and Thermal Energy
PDF Search Title:
Optimal Sharing Electricity and Thermal EnergyOriginal File Name Searched:
sustainability-14-10125-v2.pdfDIY PDF Search: Google It | Yahoo | Bing
Turbine and System Plans CAD CAM: Special for this month, any plans are $10,000 for complete Cad/Cam blueprints. License is for one build. Try before you buy a production license. More Info
Waste Heat Power Technology: Organic Rankine Cycle uses waste heat to make electricity, shaft horsepower and cooling. More Info
All Turbine and System Products: Infinity Turbine ORD systems, turbine generator sets, build plans and more to use your waste heat from 30C to 100C. More Info
CO2 Phase Change Demonstrator: CO2 goes supercritical at 30 C. This is a experimental platform which you can use to demonstrate phase change with low heat. Includes integration area for small CO2 turbine, static generator, and more. This can also be used for a GTL Gas to Liquids experimental platform. More Info
Introducing the Infinity Turbine Products Infinity Turbine develops and builds systems for making power from waste heat. It also is working on innovative strategies for storing, making, and deploying energy. More Info
Need Strategy? Use our Consulting and analyst services Infinity Turbine LLC is pleased to announce its consulting and analyst services. We have worked in the renewable energy industry as a researcher, developing sales and markets, along with may inventions and innovations. More Info
Made in USA with Global Energy Millennial Web Engine These pages were made with the Global Energy Web PDF Engine using Filemaker (Claris) software.
Sand Battery Sand and Paraffin for TES Thermo Energy Storage More Info
| CONTACT TEL: 608-238-6001 Email: greg@infinityturbine.com | RSS | AMP |