PDF Publication Title:
Text from PDF Page: 022
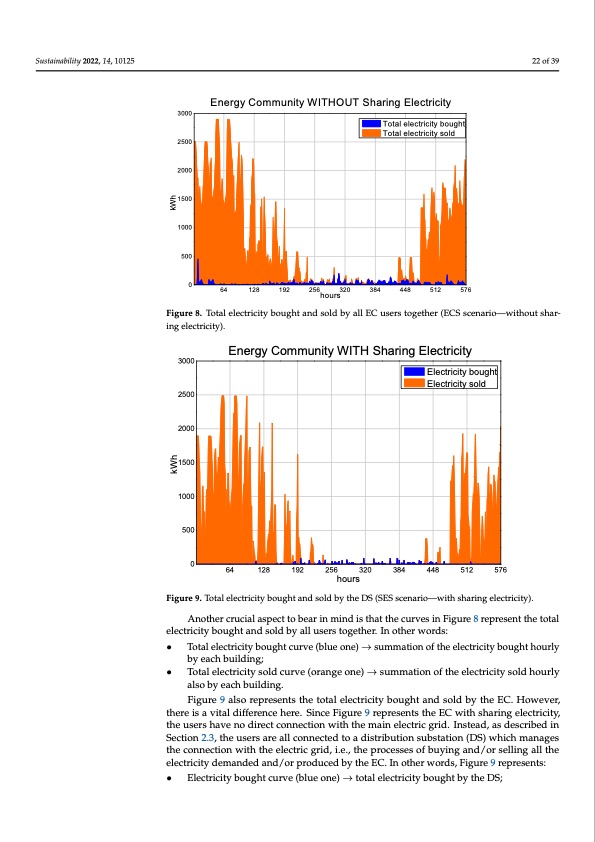
Sustainability 2022, 14, 10125 With the aim to make the effect on the electricity exchange more evident to the reader, Figures 8 and 9 were included to demonstrate the behaviour of the electricity bought and sold throughout a year. Figure 8 represents the electricity exchange between the EC and the electric grid for the scenario without sharing electricity (ECS), while Figure 9 repre- sents the scenario with sharing electricity (SES). Since the hourly behaviour of an entire year is represented by 12 months made of two typical days each (working and non-work- Figure 8. Total electricity bought and sold by all EC users together (ECS scenario—without shar- Figure 8. Total electricity bought and sold by all EC users together (ECS scenario—without sharing ienlgecetlreicittryic)i.ty). 3000 2500 2000 1500 1000 500 0 Energy Community WITH Sharing Electricity 22 of 39 ing days), the total number of hours presented in both graphs is 576. kWh kWh Sustainability 2022, 14, 10125 24 of 41 3000 2500 2000 1500 1000 500 0 Total electricity bought Total electricity sold Energy Community WITHOUT Sharing Electricity 64 128 192 256 320 hours 384 448 512 576 Electricity bought Electricity sold 64 128 192 256 320 hours 384 448 512 576 Figure9.TotallellectriiciityboughttandsolldbyttheDS((SESsscenarriio—wiitthsshaarriingeelleeccttrriicciitty)).. Another crucial aspect to bear in mind is that the curves in Figure 8 represent the total Another crucial aspect to bear in mind is that the curves in Figure 8 represent the electricity bought and sold by all users together. In other words: total electricity bought and sold by all users together. In other words: • Total electricity bought curve (blue one) → summation of the electricity bought hourly • Total electricity bought curve (blue one)summation of the electricity bought by each building; hourly by each building; • Total electricity sold curve (orange one) → summation of the electricity sold hourly • Total electricity sold curve (orange one)summation of the electricity sold hourly also by each building. also by each building. Figure 9 also represents the total electricity bought and sold by the EC. However, Figure 9 also represents the total electricity bought and sold by the EC. However, there is a vital difference here. Since Figure 9 represents the EC with sharing electricity, there is a vital difference here. Since Figure 9 represents the EC with sharing electricity, the users have no direct connection with the main electric grid. Instead, as described in the users have no direct connection with the main electric grid. Instead, as described in Section 2.3, the users are all connected to a distribution substation (DS) which manages Section 2.3, the users are all connected to a distribution substation (DS) which manages the connection with the electric grid, i.e., the processes of buying and/or selling all the the connection with the electric grid, i.e., the processes of buying and/or selling all the electricity demanded and/or produced by the EC. In other words, Figure 9 represents: electricity demanded and/or produced by the EC. In other words, Figure 9 represents: • Electricity bought curve (blue one) → total electricity bought by the DS; • Electricity bought curve (blue one)total electricity bought by the DS; • Electricity sold curve (orange one)total electricity sold by the DS. By comparing Figures 8 and 9, the effect of the presented sharing electricity method- ology is evident. The total electricity sold in Figure 8 (without sharing electricity) is more prominent if compared with the equivalent curve in Figure 9 (with sharing electricity).PDF Image | Optimal Sharing Electricity and Thermal Energy
PDF Search Title:
Optimal Sharing Electricity and Thermal EnergyOriginal File Name Searched:
sustainability-14-10125-v2.pdfDIY PDF Search: Google It | Yahoo | Bing
Turbine and System Plans CAD CAM: Special for this month, any plans are $10,000 for complete Cad/Cam blueprints. License is for one build. Try before you buy a production license. More Info
Waste Heat Power Technology: Organic Rankine Cycle uses waste heat to make electricity, shaft horsepower and cooling. More Info
All Turbine and System Products: Infinity Turbine ORD systems, turbine generator sets, build plans and more to use your waste heat from 30C to 100C. More Info
CO2 Phase Change Demonstrator: CO2 goes supercritical at 30 C. This is a experimental platform which you can use to demonstrate phase change with low heat. Includes integration area for small CO2 turbine, static generator, and more. This can also be used for a GTL Gas to Liquids experimental platform. More Info
Introducing the Infinity Turbine Products Infinity Turbine develops and builds systems for making power from waste heat. It also is working on innovative strategies for storing, making, and deploying energy. More Info
Need Strategy? Use our Consulting and analyst services Infinity Turbine LLC is pleased to announce its consulting and analyst services. We have worked in the renewable energy industry as a researcher, developing sales and markets, along with may inventions and innovations. More Info
Made in USA with Global Energy Millennial Web Engine These pages were made with the Global Energy Web PDF Engine using Filemaker (Claris) software.
Sand Battery Sand and Paraffin for TES Thermo Energy Storage More Info
| CONTACT TEL: 608-238-6001 Email: greg@infinityturbine.com | RSS | AMP |