PDF Publication Title:
Text from PDF Page: 027
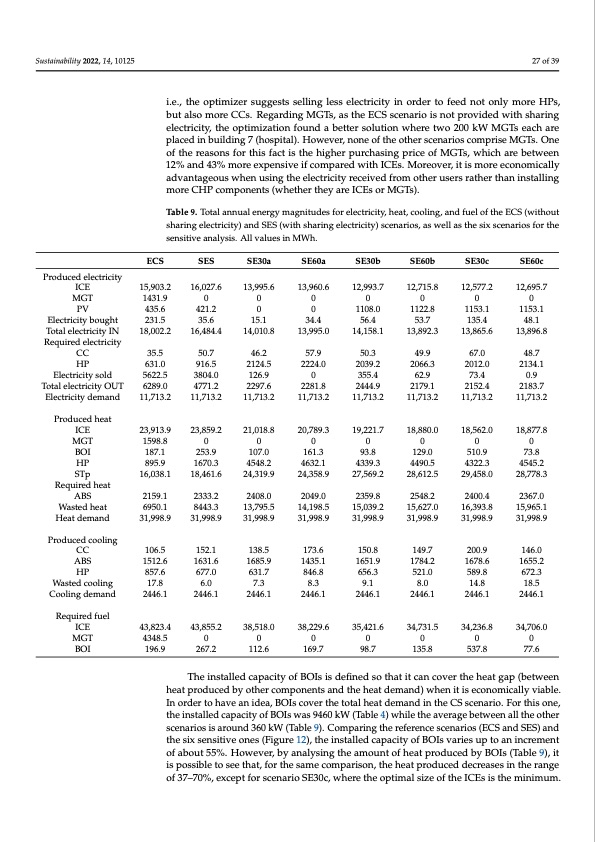
Sustainability 2022, 14, 10125 27 of 39 i.e., the optimizer suggests selling less electricity in order to feed not only more HPs, but also more CCs. Regarding MGTs, as the ECS scenario is not provided with sharing electricity, the optimization found a better solution where two 200 kW MGTs each are placed in building 7 (hospital). However, none of the other scenarios comprise MGTs. One of the reasons for this fact is the higher purchasing price of MGTs, which are between 12% and 43% more expensive if compared with ICEs. Moreover, it is more economically advantageous when using the electricity received from other users rather than installing more CHP components (whether they are ICEs or MGTs). Table 9. Total annual energy magnitudes for electricity, heat, cooling, and fuel of the ECS (without sharing electricity) and SES (with sharing electricity) scenarios, as well as the six scenarios for the sensitive analysis. All values in MWh. ECS SES SE30a SE60a SE30b SE60b SE30c SE60c 15,903.2 16,027.6 13,995.6 13,960.6 12,993.7 12,715.8 12,577.2 12,695.7 MGT 1431.9 0 0 0 0 0 0 0 Produced electricity ICE PV Electricity bought Total electricity IN Required electricity CC HP Electricity sold Total electricity OUT Electricity demand BOI HP STp Required heat ABS Wasted heat Heat demand Produced cooling CC ABS HP Wasted cooling Cooling demand 435.6 231.5 18,002.2 35.5 631.0 5622.5 6289.0 11,713.2 421.2 35.6 16,484.4 50.7 916.5 3804.0 4771.2 11,713.2 0 15.1 14,010.8 46.2 2124.5 126.9 2297.6 11,713.2 0 34.4 13,995.0 57.9 2224.0 0 2281.8 11,713.2 1108.0 56.4 14,158.1 50.3 2039.2 355.4 2444.9 11,713.2 1122.8 53.7 13,892.3 49.9 2066.3 62.9 2179.1 11,713.2 1153.1 135.4 13,865.6 67.0 2012.0 73.4 2152.4 11,713.2 1153.1 48.1 13,896.8 48.7 2134.1 0.9 2183.7 11,713.2 Produced heat ICE 23,913.9 MGT 1598.8 0 0 0 0 0 0 0 Required fuel ICE 43,855.2 267.2 112.6 169.7 98.7 135.8 537.8 77.6 The installed capacity of BOIs is defined so that it can cover the heat gap (between heat produced by other components and the heat demand) when it is economically viable. In order to have an idea, BOIs cover the total heat demand in the CS scenario. For this one, the installed capacity of BOIs was 9460 kW (Table 4) while the average between all the other scenarios is around 360 kW (Table 9). Comparing the reference scenarios (ECS and SES) and the six sensitive ones (Figure 12), the installed capacity of BOIs varies up to an increment of about 55%. However, by analysing the amount of heat produced by BOIs (Table 9), it is possible to see that, for the same comparison, the heat produced decreases in the range of 37–70%, except for scenario SE30c, where the optimal size of the ICEs is the minimum. 187.1 895.9 16,038.1 2159.1 6950.1 31,998.9 106.5 1512.6 857.6 17.8 2446.1 253.9 1670.3 18,461.6 2333.2 8443.3 31,998.9 152.1 1631.6 677.0 6.0 2446.1 107.0 4548.2 24,319.9 2408.0 13,795.5 31,998.9 138.5 1685.9 631.7 7.3 2446.1 161.3 4632.1 24,358.9 2049.0 14,198.5 31,998.9 173.6 1435.1 846.8 8.3 2446.1 93.8 4339.3 27,569.2 2359.8 15,039.2 31,998.9 150.8 1651.9 656.3 9.1 2446.1 129.0 4490.5 28,612.5 2548.2 15,627.0 31,998.9 149.7 1784.2 521.0 8.0 2446.1 510.9 4322.3 29,458.0 2400.4 16,393.8 31,998.9 200.9 1678.6 589.8 14.8 2446.1 23,859.2 21,018.8 20,789.3 19,221.7 18,880.0 18,562.0 18,877.8 73.8 4545.2 28,778.3 2367.0 15,965.1 31,998.9 146.0 1655.2 672.3 18.5 2446.1 43,823.4 MGT 4348.5 0 0 0 0 0 0 0 BOI 196.9 38,518.0 38,229.6 35,421.6 34,731.5 34,236.8 34,706.0PDF Image | Optimal Sharing Electricity and Thermal Energy
PDF Search Title:
Optimal Sharing Electricity and Thermal EnergyOriginal File Name Searched:
sustainability-14-10125-v2.pdfDIY PDF Search: Google It | Yahoo | Bing
Turbine and System Plans CAD CAM: Special for this month, any plans are $10,000 for complete Cad/Cam blueprints. License is for one build. Try before you buy a production license. More Info
Waste Heat Power Technology: Organic Rankine Cycle uses waste heat to make electricity, shaft horsepower and cooling. More Info
All Turbine and System Products: Infinity Turbine ORD systems, turbine generator sets, build plans and more to use your waste heat from 30C to 100C. More Info
CO2 Phase Change Demonstrator: CO2 goes supercritical at 30 C. This is a experimental platform which you can use to demonstrate phase change with low heat. Includes integration area for small CO2 turbine, static generator, and more. This can also be used for a GTL Gas to Liquids experimental platform. More Info
Introducing the Infinity Turbine Products Infinity Turbine develops and builds systems for making power from waste heat. It also is working on innovative strategies for storing, making, and deploying energy. More Info
Need Strategy? Use our Consulting and analyst services Infinity Turbine LLC is pleased to announce its consulting and analyst services. We have worked in the renewable energy industry as a researcher, developing sales and markets, along with may inventions and innovations. More Info
Made in USA with Global Energy Millennial Web Engine These pages were made with the Global Energy Web PDF Engine using Filemaker (Claris) software.
Sand Battery Sand and Paraffin for TES Thermo Energy Storage More Info
| CONTACT TEL: 608-238-6001 Email: greg@infinityturbine.com | RSS | AMP |