PDF Publication Title:
Text from PDF Page: 029
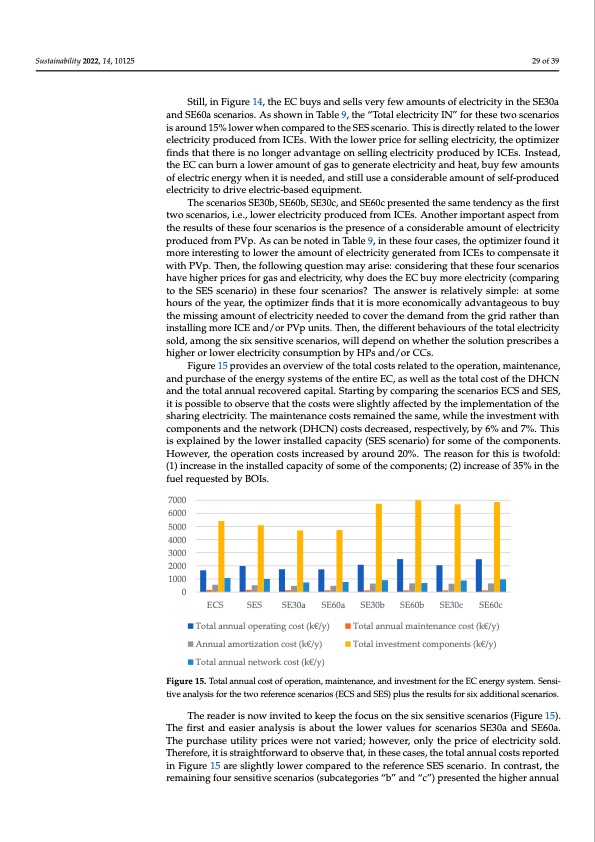
Sustainability 2022, 14, 10125 29 of 39 Sustainability 2022, 14, 10125 Still, in Figure 14, the EC buys and sells very few amounts of electricity in the SE30a and SE60a scenarios. As shown in Table 9, the “Total electricity IN” for these two scenarios is around 15% lower when compared to the SES scenario. This is directly related to the lower electricity produced from ICEs. With the lower price for selling electricity, the optimizer 31 of 41 first twThoesscceennaarriiooss, Si.Ee.3,0lbo,wSeEr60eble,cStEri3c0itcy, apnrdodSuEc6e0dc pfroemsenItCeEdst.hAe nsaomtherteinmdpenocrtyaanst tahsepfiecrtst frtowmosthcenraersiuolst,si.oef.,tlhoewserfoeulercstrciecnitayriporsoidsutchedpfreosmenIcCeEosf.aAcnoontshiedreirmabploeratamnotuanspteocfteflreocm- trtihceityrepsuroltdsuocfetdhefrsoemfoPuVr psc.eAnsarciaons bisetnhoetpedreisnenTcaebolef 9a,cionntshiedserafobuler acmasoesu,ntthoefoeplteicmtriizceitry fopuronduictemdofroeminPteVreps.tiAnsgctaonlobwe nerotehde ianmToaubnlet 9o,fienlethctersieciftoyugrecnaesreast,etdhefropmtimICizEesrtfoocuonmd-it pmenosraeteinitewreistthinPgVtpo.lTowhenr,ttheafmololouwnitnogf qelueecsttriocintymgaeynearaiste:dcfornosmidIeCriEnsgtothcaotmthpeesnesfaotuerit swceintharPioVsph.aTvheehni,gtherfporlilcoewsifnogrgqausesatniodnelmecatyriacirtiys,ew:choynsdiodesritnhgetEhCatbtuhyesmeoforeurelsecetnriacritioys finds that there is no longer advantage on selling electricity produced by ICEs. Instead, the EC can burn a lower amount of gas to generate electricity and heat, buy few amounts of electric energy when it is needed, and still use a considerable amount of self-produced elecTtrhiceitsycteonadriiovse SeEle3c0tbri,cS-bEa6s0ebd, eSqEu3i0pcm, aendt. SE60c presented the same tendency as the have higher prices for gas and electricity, why does the EC buy more electricity (comparing (comparing to the SES scenario) in these four scenarios? The answer is relatively simple: to the SES scenario) in these four scenarios? The answer is relatively simple: at some at some hours of the year, the optimizer finds that it is more economically advantageous hours of the year, the optimizer finds that it is more economically advantageous to buy to buy the missing amount of electricity needed to cover the demand from the grid rather the missing amount of electricity needed to cover the demand from the grid rather than than installing more ICE and/or PVp units. Then, the different behaviours of the total elec- installing more ICE and/or PVp units. Then, the different behaviours of the total electricity tricity sold, among the six sensitive scenarios, will depend on whether the solution pre- sold, among the six sensitive scenarios, will depend on whether the solution prescribes a scribes a higher or lower electricity consumption by HPs and/or CCs. higher or lower electricity consumption by HPs and/or CCs. Figure 15 provides an overview of the total costs related to the operation, mainte- Figure 15 provides an overview of the total costs related to the operation, maintenance, nance, and purchase of the energy systems of the entire EC, as well as the total cost of the and purchase of the energy systems of the entire EC, as well as the total cost of the DHCN DHCN and the total annual recovered capital. Starting by comparing the scenarios ECS and the total annual recovered capital. Starting by comparing the scenarios ECS and SES, and SES, it is possible to observe that the costs were slightly affected by the implementa- it is possible to observe that the costs were slightly affected by the implementation of the tion of the sharing electricity. The maintenance costs remained the same, while the invest- sharing electricity. The maintenance costs remained the same, while the investment with ment with components and the network (DHCN) costs decreased, respectively, by 6% and components and the network (DHCN) costs decreased, respectively, by 6% and 7%. This 7%. This is explained by the lower installed capacity (SES scenario) for some of the com- is explained by the lower installed capacity (SES scenario) for some of the components. ponents. However, the operation costs increased by around 20%. The reason for this is However, the operation costs increased by around 20%. The reason for this is twofold: twofold: (1) increase in the installed capacity of some of the components; (2) increase of (1) increase in the installed capacity of some of the components; (2) increase of 35% in the 35% in the fuel requested by BOIs. fuel requested by BOIs. 7000 6000 5000 4000 3000 2000 1000 0 ECS SES SE30a SE60a SE30b SE60b SE30c SE60c Total annual operating cost (k€/y) Annual amortization cost (k€/y) Total annual network cost (k€/y) Total annual maintenance cost (k€/y) Total investment components (k€/y) Figure 15. Total annual cost of operation, maintenance, and investment for the EC energy system. Sensi- Figure 15. Total annual cost of operation, maintenance, and investment for the EC energy system. tive analysis for the two reference scenarios (ECS and SES) plus the results for six additional scenarios. Sensitive analysis for the two reference scenarios (ECS and SES) plus the results for six additional scenarios. The reader is now invited to keep the focus on the six sensitive scenarios (Figure 15). The first and easier analysis is about the lower values for scenarios SE30a and SE60a. The reader is now invited to keep the focus on the six sensitive scenarios (Figure 15). The purchase utility prices were not varied; however, only the price of electricity sold. The first and easier analysis is about the lower values for scenarios SE30a and SE60a. The Therefore, it is straightforward to observe that, in these cases, the total annual costs reported purchase utility prices were not varied; however, only the price of electricity sold. There- in Figure 15 are slightly lower compared to the reference SES scenario. In contrast, the fore, it is straightforward to observe that, in these cases, the total annual costs reported in remaining four sensitive scenarios (subcategories “b” and “c”) presented the higher annual Figure 15 are slightly lower compared to the reference SES scenario. In contrast, the re- maining four sensitive scenarios (subcategories “b” and “c”) presented the higher annual cost results, which are directly related to the higher prices of gas and electricity. This is especially true for the total annual operating costs, which were 32% higher (on average) than the “a” scenario and are directly associated to the price of the gas. Bearing the samePDF Image | Optimal Sharing Electricity and Thermal Energy
PDF Search Title:
Optimal Sharing Electricity and Thermal EnergyOriginal File Name Searched:
sustainability-14-10125-v2.pdfDIY PDF Search: Google It | Yahoo | Bing
Turbine and System Plans CAD CAM: Special for this month, any plans are $10,000 for complete Cad/Cam blueprints. License is for one build. Try before you buy a production license. More Info
Waste Heat Power Technology: Organic Rankine Cycle uses waste heat to make electricity, shaft horsepower and cooling. More Info
All Turbine and System Products: Infinity Turbine ORD systems, turbine generator sets, build plans and more to use your waste heat from 30C to 100C. More Info
CO2 Phase Change Demonstrator: CO2 goes supercritical at 30 C. This is a experimental platform which you can use to demonstrate phase change with low heat. Includes integration area for small CO2 turbine, static generator, and more. This can also be used for a GTL Gas to Liquids experimental platform. More Info
Introducing the Infinity Turbine Products Infinity Turbine develops and builds systems for making power from waste heat. It also is working on innovative strategies for storing, making, and deploying energy. More Info
Need Strategy? Use our Consulting and analyst services Infinity Turbine LLC is pleased to announce its consulting and analyst services. We have worked in the renewable energy industry as a researcher, developing sales and markets, along with may inventions and innovations. More Info
Made in USA with Global Energy Millennial Web Engine These pages were made with the Global Energy Web PDF Engine using Filemaker (Claris) software.
Sand Battery Sand and Paraffin for TES Thermo Energy Storage More Info
| CONTACT TEL: 608-238-6001 Email: greg@infinityturbine.com | RSS | AMP |