PDF Publication Title:
Text from PDF Page: 007
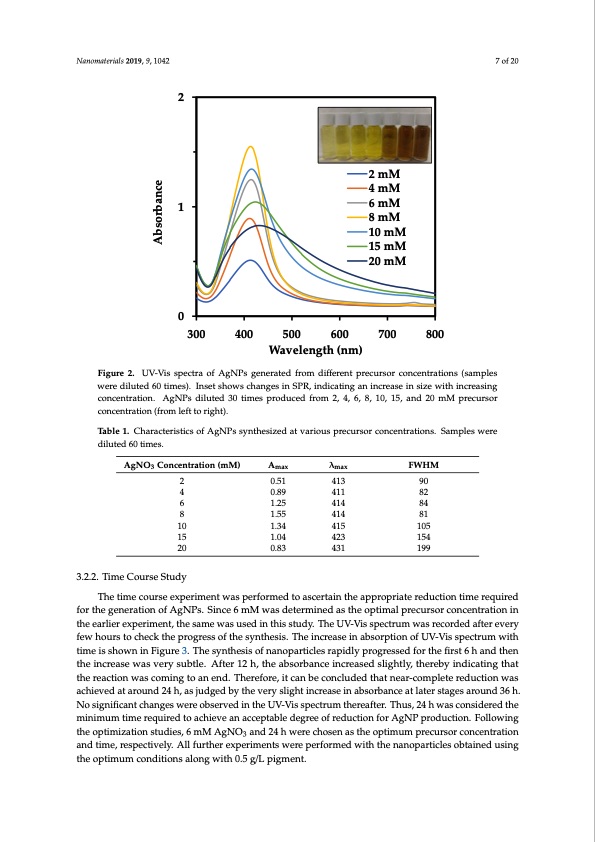
Nanomaterials 2019, 9, 1042 Nanomaterials 2019, 9, x FOR PEER REVIEW 2 1 0 Figure 2. UV-Vis spectra of AgNPs generated from different precursor concentrations (samples Figure 2. UV-Vis spectra of AgNPs generated from different precursor concentrations (samples were were diluted 60 times). Inset shows changes in SPR, indicating an increase in size with increasing diluted 60 times). Inset shows changes in SPR, indicating an increase in size with increasing concentration. AgNPs diluted 30 times produced from 2, 4, 6, 8, 10, 15, and 20 mM precursor concentration. AgNPs diluted 30 times produced from 2, 4, 6, 8, 10, 15, and 20 mM precursor concentration (from left to right). concentration (from left to right). Table 1. Characteristics of AgNPs synthesized at various precursor concentrations. Samples were Table 1. Characteristics of AgNPs synthesized at various precursor concentrations. Samples were λmax FWHM Amax λmax FWHM 4130.514139090 411 82 4140.894118482 4141.254148184 415 423 431 diluted 60 times. diluted 60 times. AgNO3 Concentration (mM) Amax AgNO3 Concentration (mM) 22 0.51 7 of 20 7 of 20 Absorbance 300 400 500 Wavelength (nm) 2 mM 4 mM 6 mM 8 mM 10 mM 15 mM 20 mM 600 700 800 4 64 86 10 8 15 10 20 15 20 0.89 1.25 1.55 1.34 1.04 0.83 414 105 81 415 154 105 1.55 1.34 1.04 423 154 0.83 431 199 199 3.2.2. Time Course Study The time course experiment was performed to ascertain the appropriate reduction time required 3.2.2. Time Course Study for the generation of AgNPs. Since 6 mM was determined as the optimal precursor concentration in The time course experiment was performed to ascertain the appropriate reduction time the earlier experiment, the same was used in this study. The UV-Vis spectrum was recorded after every required for the generation of AgNPs. Since 6 mM was determined as the optimal precursor few hours to check the progress of the synthesis. The increase in absorption of UV-Vis spectrum with concentration in the earlier experiment, the same was used in this study. The UV-Vis spectrum was time is shown in Figure 3. The synthesis of nanoparticles rapidly progressed for the first 6 h and then recorded after every few hours to check the progress of the synthesis. The increase in absorption of the increase was very subtle. After 12 h, the absorbance increased slightly, thereby indicating that UV-Vis spectrum with time is shown in Figure 3. The synthesis of nanoparticles rapidly progressed the reaction was coming to an end. Therefore, it can be concluded that near-complete reduction was for the first 6 h and then the increase was very subtle. After 12 h, the absorbance increased slightly, achieved at around 24 h, as judged by the very slight increase in absorbance at later stages around 36 h. thereby indicating that the reaction was coming to an end. Therefore, it can be concluded that No significant changes were observed in the UV-Vis spectrum thereafter. Thus, 24 h was considered the near-complete reduction was achieved at around 24 h, as judged by the very slight increase in minimum time required to achieve an acceptable degree of reduction for AgNP production. Following absorbance at later stages around 36 h. No significant changes were observed in the UV-Vis the optimization studies, 6 mM AgNO3 and 24 h were chosen as the optimum precursor concentration spectrum thereafter. Thus, 24 h was considered the minimum time required to achieve an acceptable and time, respectively. All further experiments were performed with the nanoparticles obtained using degree of reduction for AgNP production. Following the optimization studies, 6 mM AgNO3 and 24 the optimum conditions along with 0.5 g/L pigment. h were chosen as the optimum precursor concentration and time, respectively. All furtherPDF Image | Biosynthesis of Silver Nanoparticles Talaromyces purpurogenus
PDF Search Title:
Biosynthesis of Silver Nanoparticles Talaromyces purpurogenusOriginal File Name Searched:
nanomaterials-09-01042.pdfDIY PDF Search: Google It | Yahoo | Bing
Turbine and System Plans CAD CAM: Special for this month, any plans are $10,000 for complete Cad/Cam blueprints. License is for one build. Try before you buy a production license. More Info
Waste Heat Power Technology: Organic Rankine Cycle uses waste heat to make electricity, shaft horsepower and cooling. More Info
All Turbine and System Products: Infinity Turbine ORD systems, turbine generator sets, build plans and more to use your waste heat from 30C to 100C. More Info
CO2 Phase Change Demonstrator: CO2 goes supercritical at 30 C. This is a experimental platform which you can use to demonstrate phase change with low heat. Includes integration area for small CO2 turbine, static generator, and more. This can also be used for a GTL Gas to Liquids experimental platform. More Info
Introducing the Infinity Turbine Products Infinity Turbine develops and builds systems for making power from waste heat. It also is working on innovative strategies for storing, making, and deploying energy. More Info
Need Strategy? Use our Consulting and analyst services Infinity Turbine LLC is pleased to announce its consulting and analyst services. We have worked in the renewable energy industry as a researcher, developing sales and markets, along with may inventions and innovations. More Info
Made in USA with Global Energy Millennial Web Engine These pages were made with the Global Energy Web PDF Engine using Filemaker (Claris) software.
Infinity Turbine Developing Spinning Disc Reactor SDR or Spinning Disc Reactors reduce processing time for liquid production of Silver Nanoparticles.
| CONTACT TEL: 608-238-6001 Email: greg@infinityturbine.com | RSS | AMP |