PDF Publication Title:
Text from PDF Page: 009
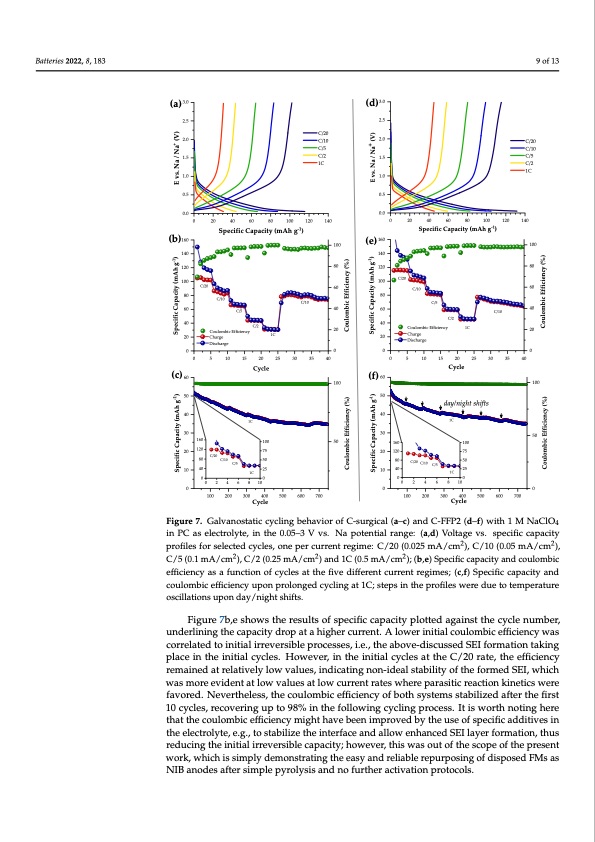
Batteries 2022, 8, x FOR PEER REVIEW Batteries 2022, 8, 183 (a) 3.0 2.5 2.0 1.5 1.0 0.5 0.0 (b)160 140 120 100 80 60 40 20 10 of 15 9 of 13 C/20 C/10 C/5 C/2 1C 0 20 40 60 80 100 120 140 Specific Capacity (mAh g-1) (d) 3.0 2.5 2.0 1.5 1.0 0.5 0.0 (e) 160 140 C/20 C/10 C/5 C/2 1C 0 20 40 60 80 100 120 140 Specific Capacity (mAh g-1) C/10 (c) 60 50 40 30 100 50 (f) 60 50 40 30 20 10 Cycle day/night shifts 1C 100 75 50 25 100 50 C/2 Coulombic Efficiency Charge 1C Coulombic Efficiency 1C Charge Discharge 100 100 80 60 C/10 40 20 C/20 C/10 C/10 60 20 C/5 C/5 80 120 100 80 40 60 40 20 C/20 Discharge 0000 0 5 10 15 20 25 30 35 40 Cycle 1C 100 75 50 25 1C 00 00 C/2 0 5 10 15 20 25 30 35 40 160 20 120 80 10 40 C/20 160 120 80 40 C/10 C/5 C/20 C/10 C/5 1C Specific Capacity (mAh g-1) Specific Capacity (mAh g-1) E vs. Na / Na+ (V) Coulombic Efficiency (%) Coulombic Efficiency (%) Specific Capacity (mAh g-1) Specific Capacity (mAh g-1) E vs. Na / Na+ (V) Coulombic Efficiency (%) Coulombic Efficiency (%) 0 2 4 6 8 10 0 2 4 6 8 10 000 100 200 300 400 500 600 700 100 200 300 400 500 600 700 Cycle Cycle Figure 7. Galvanostatic cycling behavior of C-surgical (a–c) and C-FFP2 (d–f) with 1 M NaClO4 in Figure 7. Galvanostatic cycling behavior of C-surgical (a–c) and C-FFP2 (d–f) with 1 M NaClO4 PC as electrolyte, in the 0.05–3 V vs. Na potential range: (a,d) Voltage vs. specific capacity profiles in PC as electrolyte, in the 0.05–3 V vs. Na potential range: (a,d) Voltage vs. specific capacity for selected cycles, one per current regime: C/20 (0.025 mA/cm2), C/10 (02.05 mA/cm2), C/5 (0.12 profiles for selected cycles, one per current regime: C/20 (0.025 mA/cm ), C/10 (0.05 mA/cm ), mA/cm2), C/2 (0.25 mA/cm2) and 1C (0.5 mA/cm2); (b,e) Specific capacity and coulombic efficiency C/5 (0.1 mA/cm2), C/2 (0.25 mA/cm2) and 1C (0.5 mA/cm2); (b,e) Specific capacity and coulombic as a function of cycles at the five different current regimes; (c,f) Specific capacity and coulombic efficiency as a function of cycles at the five different current regimes; (c,f) Specific capacity and efficiency upon prolonged cycling at 1C; steps in the profiles were due to temperature oscillations coulombic efficiency upon prolonged cycling at 1C; steps in the profiles were due to temperature upon day/night shifts. oscillations upon day/night shifts. Figure 7b,e shows the results of specific capacity plotted against the cycle number, Figure 7b,e shows the results of specific capacity plotted against the cycle number, underlining the capacity drop at a higher current. A lower initial coulombic efficiency was underlining the capacity drop at a higher current. A lower initial coulombic efficiency was correlated to initial irreversible processes, i.e., the above-discussed SEI formation taking correlated to initial irreversible processes, i.e., the above-discussed SEI formation taking place in the initial cycles. However, in the initial cycles at the C/20 rate, the efficiency place in the initial cycles. However, in the initial cycles at the C/20 rate, the efficiency remained at relatively low values, indicating non-ideal stability of the formed SEI, which remained at relatively low values, indicating non-ideal stability of the formed SEI, which was more evident at low values at low current rates where parasitic reaction kinetics were was more evident at low values at low current rates where parasitic reaction kinetics were favored. Nevertheless, the coulombic efficiency of both systems stabilized after the first favored. Nevertheless, the coulombic efficiency of both systems stabilized after the first 10 cycles, recovering up to 98% in the following cycling process. It is worth noting here 10 cycles, recovering up to 98% in the following cycling process. It is worth noting here that the coulombic efficiency might have been improved by the use of specific additives that the coulombic efficiency might have been improved by the use of specific additives in in the electrolyte, e.g., to stabilize the interface and allow enhanced SEI layer formation, the electrolyte, e.g., to stabilize the interface and allow enhanced SEI layer formation, thus thus reducing the initial irreversible capacity; however, this was out of the scope of the reducing the initial irreversible capacity; however, this was out of the scope of the present present work, which is simply demonstrating the easy and reliable repurposing of work, which is simply demonstrating the easy and reliable repurposing of disposed FMs as disposed FMs as NIB anodes after simple pyrolysis and no further activation protocols. NIB anodes after simple pyrolysis and no further activation protocols.PDF Image | From Wastes to Anode Materials for Na-Ion Batteries
PDF Search Title:
From Wastes to Anode Materials for Na-Ion BatteriesOriginal File Name Searched:
batteries-08-00183.pdfDIY PDF Search: Google It | Yahoo | Bing
Salgenx Redox Flow Battery Technology: Salt water flow battery technology with low cost and great energy density that can be used for power storage and thermal storage. Let us de-risk your production using our license. Our aqueous flow battery is less cost than Tesla Megapack and available faster. Redox flow battery. No membrane needed like with Vanadium, or Bromine. Salgenx flow battery
| CONTACT TEL: 608-238-6001 Email: greg@salgenx.com | RSS | AMP |