PDF Publication Title:
Text from PDF Page: 004
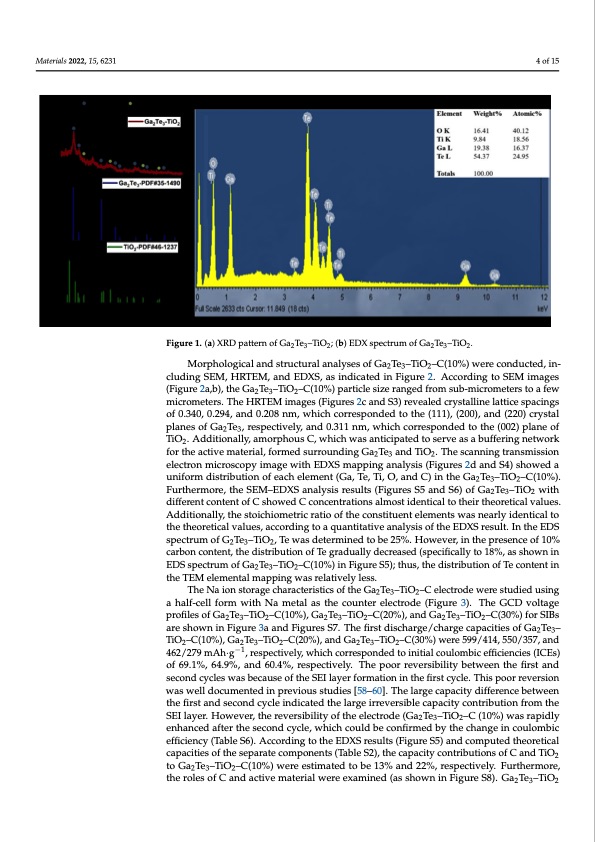
Materials 2022, 15, x FOR PEER REVIEW 4 of 15 Materials 2022, 15, 6231 reasonable with the stoichiometric ratio of Ga2Te3 and TiO2 (Figure 1b), indicating that the Ga2Te3-based composite was synthesized successfully. Morphological and structural analyses of Ga2Te3–TiO2–C(10%) were conducted, in- (Figure 2a,b), the Ga2Te3–TiO2–C(10%) particle size ranged from sub-micrometers to a few (Figure 2a,b), the Ga2Te3–TiO2–C(10%) particle size ranged from sub-micrometers to a few micrometers. The HRTEM images (Figures 2c and S3) revealed crystalline lattice spacings micrometers. The HRTEM images (Figures 2c and S3) revealed crystalline lattice spacings of 0.340, 0.294, and 0.208 nm, which corresponded to the (111), (200), and (220) crystal of 0.340, 0.294, and 0.208 nm, which corresponded to the (111), (200), and (220) crystal planes of Ga2Te3, respectively, and 0.311 nm, which corresponded to the (002) plane of planTeiOso.fAGdad2iTtioe3n,arlleys,paemcotirvpehloyu,saCnd,w0h.3ic1h1wnams,anwtihcipchatecdortroeseprovendasedabtuofftehrein(g0n02et)wpolrakneof 2 TiOf2o.rAthdedaitcitoivnealmlya,tearmiaol,rfpohrmoueds sCu,rwrohuincdhinwgaGsaanTeticaipnadteTdiOto. Tsehrevsecansnainbgutfrfaenrsimngisnsieotnwork 232 electron microscopy image with EDXS mapping analysis (Figures 2d and S4) showed a for the active material, formed surrounding Ga2Te3 and TiO2. The scanning transmission uniform distribution of each element (Ga, Te, Ti, O, and C) in the Ga Te –TiO –C(10%). 232 4 of 15 Figure 1. (a) XRD pattern of Ga2Te3–TiO2; (b) EDX spectrum of Ga2Te3–TiO2. Figure 1. (a) XRD pattern of Ga2Te3–TiO2; (b) EDX spectrum of Ga2Te3–TiO2. cluding SEM, HRTEM, and EDXS, as indicated in Figure 2. According to SEM images cluding SEM, HRTEM, and EDXS, as indicated in Figure 2. According to SEM images Morphological and structural analyses of Ga Te –TiO –C(10%) were conducted, in- 232 electron microscopy image with EDXS mapping analysis (Figures 2d and S4) showed a Furthermore, the SEM–EDXS analysis results (Figures S5 and S6) of Ga2Te3–TiO2 with uniform distribution of each element (Ga, Te, Ti, O, and C) in the Ga2Te3–TiO2–C(10%). different content of C showed C concentrations almost identical to their theoretical values. Furthermore, the SEM–EDXS analysis results (Figures S5 and S6) of Ga2Te3–TiO2 with Additionally, the stoichiometric ratio of the constituent elements was nearly identical to different content of C showed C concentrations almost identical to their theoretical values. the theoretical values, according to a quantitative analysis of the EDXS result. In the EDS Additionally, the stoichiometric ratio of the constituent elements was nearly identical to spectrum of G2Te3–TiO2, Te was determined to be 25%. However, in the presence of 10% thectharebornetciocnatlevnat,ltuhesd,iasctrciobrudtionngotfoTaegqruaadnutailtlaytdiveecraenasaeldys(sispeocfifithcaellEyDtoX1S8%re,sauslsth.oInwtnhienEDS specEtDruSmspoecftrGu2mTeo3f–GTiaOT2e, T–eTiwOa–sCd(1e0te%r)mininFeigdutroe Sb5e);2t5h%us.,Hthoewdiesvtreibr,uitnionthoefpTerecsoenntecnetoinf 10% 232 the TEM elemental mapping was relatively less. carbon content, the distribution of Te gradually decreased (specifically to 18%, as shown The Na ion storage characteristics of the Ga Te –TiO –C electrode were studied using 232 in EDS spectrum of Ga2Te3–TiO2–C(10%) in Figure S5); thus, the distribution of Te content a half-cell form with Na metal as the counter electrode (Figure 3). The GCD voltage in the TEM elemental mapping was relatively less. profiles of Ga2Te3–TiO2–C(10%), Ga2Te3–TiO2–C(20%), and Ga2Te3–TiO2–C(30%) for SIBs are shown in Figure 3a and Figures S7. The first discharge/charge capacities of Ga2Te3– TiO2–C(10%), Ga2Te3–TiO2–C(20%), and Ga2Te3–TiO2–C(30%) were 599/414, 550/357, and 462/279 mAh·g−1, respectively, which corresponded to initial coulombic efficiencies (ICEs) of 69.1%, 64.9%, and 60.4%, respectively. The poor reversibility between the first and second cycles was because of the SEI layer formation in the first cycle. This poor reversion was well documented in previous studies [58–60]. The large capacity difference between the first and second cycle indicated the large irreversible capacity contribution from the SEI layer. However, the reversibility of the electrode (Ga2Te3–TiO2–C (10%) was rapidly enhanced after the second cycle, which could be confirmed by the change in coulombic efficiency (Table S6). According to the EDXS results (Figure S5) and computed theoretical capacities of the separate components (Table S2), the capacity contributions of C and TiO2 to Ga2Te3–TiO2–C(10%) were estimated to be 13% and 22%, respectively. Furthermore, the roles of C and active material were examined (as shown in Figure S8). Ga2Te3–TiO2PDF Image | Ga2Te3-Based Anodes for Sodium-Ion Batteries
PDF Search Title:
Ga2Te3-Based Anodes for Sodium-Ion BatteriesOriginal File Name Searched:
materials-15-06231.pdfDIY PDF Search: Google It | Yahoo | Bing
Salgenx Redox Flow Battery Technology: Salt water flow battery technology with low cost and great energy density that can be used for power storage and thermal storage. Let us de-risk your production using our license. Our aqueous flow battery is less cost than Tesla Megapack and available faster. Redox flow battery. No membrane needed like with Vanadium, or Bromine. Salgenx flow battery
| CONTACT TEL: 608-238-6001 Email: greg@salgenx.com | RSS | AMP |