PDF Publication Title:
Text from PDF Page: 009
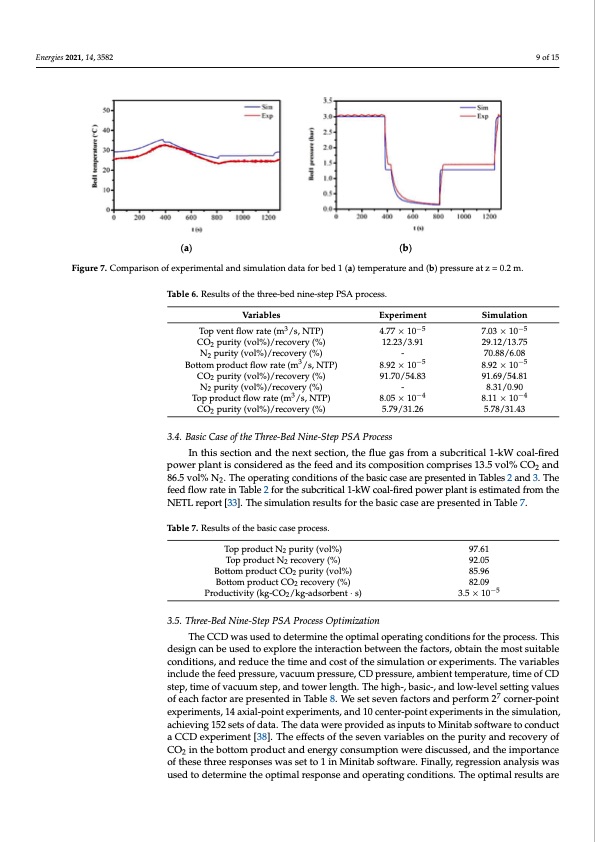
centration of N is 84.64 vol%, the feed flow rate, feed pressure, vacuum pressure, vent Energies 2021, 14, 3582 2 pressure, surrounding temperature, and feed temperature are 9.703 × 10⁻⁴ m3/s, 3 atm, 0.07 atm, 0.25 atm, 303.14 K, and 303.14 K, respectively. The experimental and simulation re- sults are presented in Table 6, and the simulation results are close to the experimental results. Based on Figure 7, the temperature and pressure profiles of both the simulation 9 of 15 and experiment follow the same trend, confirming the accuracy of the simulation pro- gram. (a) (b) Figure 7. Comparison of experimental and simulation data for bed 1 (a) temperature and (b) pressure at z = 0.2 m. Figure 7. Comparison of experimental and simulation data for bed 1 (a) temperature and (b) pressure at z = 0.2 m. Table 6.. Resulltts off tthe tthree-bed nine-step PSA process. VVaarriiables ExpEerxipmereinmtent SimSuilmatuiloantion 3 −5 −5 Top vent flow rate (m3 /s, NTP) Top vent flow rate (m /s, NTP) COCO2 pupruirtiyty(v(vooll%)/rreecovery (%)) 2 N purity(vol%)/recovery(%) N2 p2urity (vol%)/recovery (%) 4.77 × 10 −5 4.77 × 10 7.03 × 10 −5 7.03 × 10 Bottom product flow rate (m3/s, NTP) 8.92 ×−10−5 8.92 × 10 5 Bottom product flow rate (m3/s, NTP) CO2 purity (vol%)/recovery (%) 91.70/54.83 91.69/54.81 CO2 purity (vol%)/recovery (%) 91.70/54.83 91.69/54.81 N2 purity (vol%)/recovery (%) - 8.05 × 10 8.31/0.90 8.31/0.90 −4 N2 purity (vol%)/recov3ery (%) Top product flow rate (m /s, NTP) - −4 8.11 × 10 3 −4 −4 TopCpOropduurcittyf(lvoowl%r)a/tree(cmove/rsy, N(%T)P) 8.055×.791/031.26 8.115.×781/031.43 CO2 purity (vol%)/recovery (%) 5.79/31.26 5.78/31.43 3.4. Basic Case of the Three-Bed Nine-Step PSA Process In this section and the next section, the flue gas from a subcritical 1-kW coal-fired power plant is considered as the feed and its composition comprises 13.5 vol% CO2 and 86.5 vol% N2. The operating conditions of the basic case are presented in Tables 2 and 3. The feed flow rate in Table 2 for the subcritical 1-kW coal-fired power plant is estimated from the NETL report [33]. The simulation results for the basic case are presented in Table 7. 2 12.2132/.32.39/13.91 29.1229/.132/.7153.75 - 8.92 ×−10−5 70.88/6.08 - 8.92 × 10 5 70.88/6.08 Table 7. Results of the basic case process. Top product N2 purity (vol%) Top product N2 recovery (%) Bottom product CO2 purity (vol%) Bottom product CO2 recovery (%) Productivity (kg-CO2/kg-adsorbent · s) 3.5. Three-Bed Nine-Step PSA Process Optimization 97.61 92.05 85.96 82.09 3.5 × 10⁻⁵ The CCD was used to determine the optimal operating conditions for the process. This design can be used to explore the interaction between the factors, obtain the most suitable conditions, and reduce the time and cost of the simulation or experiments. The variables include the feed pressure, vacuum pressure, CD pressure, ambient temperature, time of CD step, time of vacuum step, and tower length. The high-, basic-, and low-level setting values of each factor are presented in Table 8. We set seven factors and perform 27 corner-point experiments, 14 axial-point experiments, and 10 center-point experiments in the simulation, achieving 152 sets of data. The data were provided as inputs to Minitab software to conduct a CCD experiment [38]. The effects of the seven variables on the purity and recovery of CO2 in the bottom product and energy consumption were discussed, and the importance of these three responses was set to 1 in Minitab software. Finally, regression analysis was used to determine the optimal response and operating conditions. The optimal results arePDF Image | CO2 captured from flue gas using the PSA process
PDF Search Title:
CO2 captured from flue gas using the PSA processOriginal File Name Searched:
energies-14-03582-v2.pdfDIY PDF Search: Google It | Yahoo | Bing
CO2 Organic Rankine Cycle Experimenter Platform The supercritical CO2 phase change system is both a heat pump and organic rankine cycle which can be used for those purposes and as a supercritical extractor for advanced subcritical and supercritical extraction technology. Uses include producing nanoparticles, precious metal CO2 extraction, lithium battery recycling, and other applications... More Info
Heat Pumps CO2 ORC Heat Pump System Platform More Info
| CONTACT TEL: 608-238-6001 Email: greg@infinityturbine.com | RSS | AMP |