PDF Publication Title:
Text from PDF Page: 085
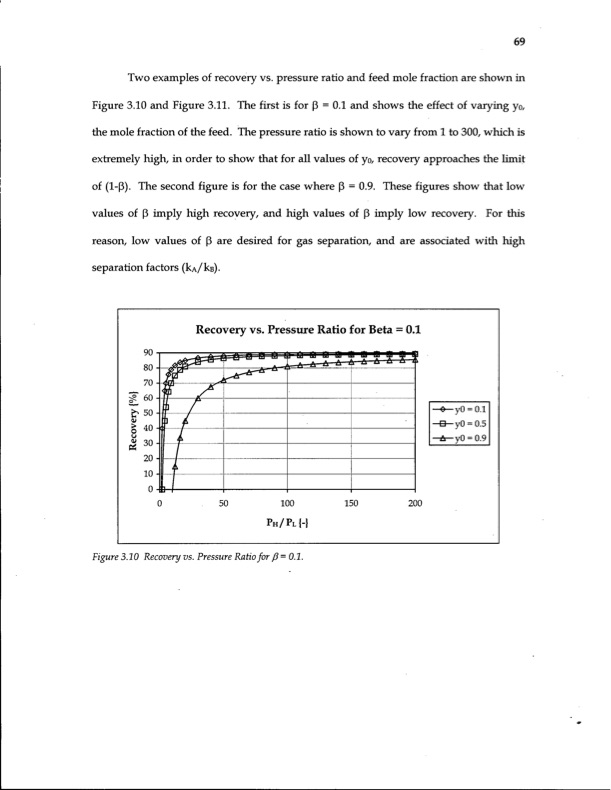
Two examples of recovery vs. pressure ratio and feed mole fraction are shown in Figure 3.10 and Figure 3.11. The first is for p = 0.1 and shows the effect of varying yo, the mole fraction of the feed. The pressure ratio is shown to vary from 1 to 300, which is extremely high, in order to show that for all values of yo, recovery approaches the limit of (1-P). The second figure is for the case where p = 0.9. These figures show that low values of p imply high recovery, and high values of p imply low recovery. For this reason, low values of P are desired for gas separation, and are associated with high separation factors (kA/kB). Recovery vs. Pressure Ratio for Beta = 0.1 0 50 100 150 200 PH/PL {-} Figure 3.10 Recovery vs. Pressure Ratio for {1= 0.1. -0—y0 = 0.1 •H-y0 = 0.5 •A—yO = 0.9 69PDF Image | Energy Efficiency of Gas Separation Pressure Swing Adsorption
PDF Search Title:
Energy Efficiency of Gas Separation Pressure Swing AdsorptionOriginal File Name Searched:
ubc_1997-0009.pdfDIY PDF Search: Google It | Yahoo | Bing
CO2 Organic Rankine Cycle Experimenter Platform The supercritical CO2 phase change system is both a heat pump and organic rankine cycle which can be used for those purposes and as a supercritical extractor for advanced subcritical and supercritical extraction technology. Uses include producing nanoparticles, precious metal CO2 extraction, lithium battery recycling, and other applications... More Info
Heat Pumps CO2 ORC Heat Pump System Platform More Info
| CONTACT TEL: 608-238-6001 Email: greg@infinityturbine.com | RSS | AMP |