PDF Publication Title:
Text from PDF Page: 009
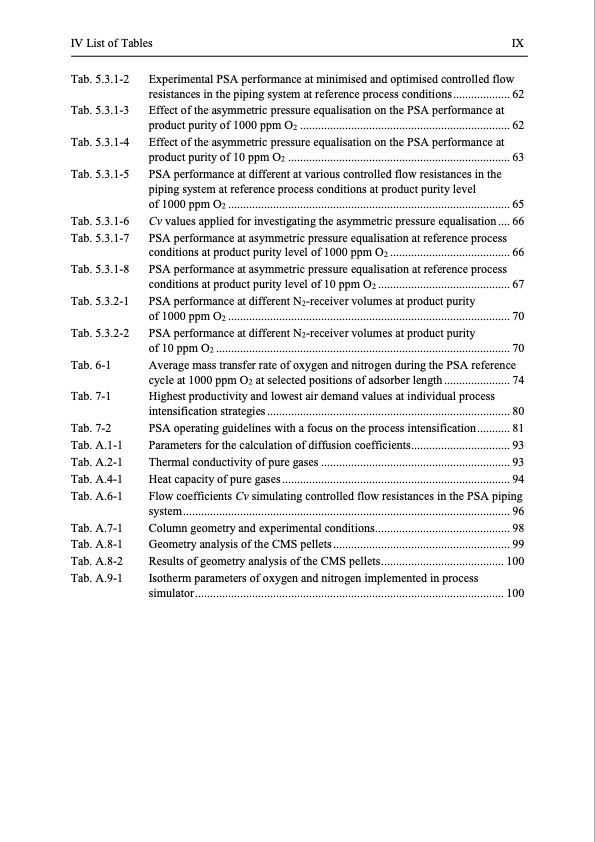
IV List of Tables IX Tab. 5.3.1-2 Tab. 5.3.1-3 Tab. 5.3.1-4 Tab. 5.3.1-5 Tab. 5.3.1-6 Tab. 5.3.1-7 Tab. 5.3.1-8 Tab. 5.3.2-1 Tab. 5.3.2-2 Tab. 6-1 Tab. 7-1 Tab. 7-2 Tab. A.1-1 Tab. A.2-1 Tab. A.4-1 Tab. A.6-1 Tab. A.7-1 Tab. A.8-1 Tab. A.8-2 Tab. A.9-1 Experimental PSA performance at minimised and optimised controlled flow resistances in the piping system at reference process conditions ................... 62 Effect of the asymmetric pressure equalisation on the PSA performance at product purity of 1000 ppm O2 ...................................................................... 62 Effect of the asymmetric pressure equalisation on the PSA performance at product purity of 10 ppm O2 .......................................................................... 63 PSA performance at different at various controlled flow resistances in the piping system at reference process conditions at product purity level of 1000 ppm O2 .............................................................................................. 65 Cv values applied for investigating the asymmetric pressure equalisation .... 66 PSA performance at asymmetric pressure equalisation at reference process conditions at product purity level of 1000 ppm O2 ........................................ 66 PSA performance at asymmetric pressure equalisation at reference process conditions at product purity level of 10 ppm O2 ............................................ 67 PSA performance at different N2-receiver volumes at product purity of 1000 ppm O2 .............................................................................................. 70 PSA performance at different N2-receiver volumes at product purity of 10 ppm O2 .................................................................................................. 70 Average mass transfer rate of oxygen and nitrogen during the PSA reference cycle at 1000 ppm O2 at selected positions of adsorber length ...................... 74 Highest productivity and lowest air demand values at individual process intensification strategies ................................................................................. 80 PSA operating guidelines with a focus on the process intensification........... 81 Parameters for the calculation of diffusion coefficients................................. 93 Thermal conductivity of pure gases ............................................................... 93 Heat capacity of pure gases ............................................................................ 94 Flow coefficients Cv simulating controlled flow resistances in the PSA piping system............................................................................................................. 96 Column geometry and experimental conditions............................................. 98 Geometry analysis of the CMS pellets ........................................................... 99 Results of geometry analysis of the CMS pellets......................................... 100 Isotherm parameters of oxygen and nitrogen implemented in process simulator ....................................................................................................... 100PDF Image | Modelling and Simulation of Twin-Bed Pressure Swing Adsorption Plants

PDF Search Title:
Modelling and Simulation of Twin-Bed Pressure Swing Adsorption PlantsOriginal File Name Searched:
dissertation_marcinek.pdfDIY PDF Search: Google It | Yahoo | Bing
CO2 Organic Rankine Cycle Experimenter Platform The supercritical CO2 phase change system is both a heat pump and organic rankine cycle which can be used for those purposes and as a supercritical extractor for advanced subcritical and supercritical extraction technology. Uses include producing nanoparticles, precious metal CO2 extraction, lithium battery recycling, and other applications... More Info
Heat Pumps CO2 ORC Heat Pump System Platform More Info
| CONTACT TEL: 608-238-6001 Email: greg@infinityturbine.com | RSS | AMP |